History Wave Diagram – Flow of Information
RB0200015-1_4
- Last Update 03/08/2025
- File Size 1.2MB
- # of Slides 2
- File Format PPTX
- Slide Ratio 4:3
- Color
Keywords
- #Content-Based Slides
- #Design-Based Slides
- #Company Introduction
- #Business Management
- #Diagram
- #History
- #Implementation Plan
- #Cluster
- #Chain Diagram
- #4:3
- #wave diagram PowerPoint
- #timeline slide template
- #4-stage flow diagram
- #connected diagram presentation
- #company history PowerPoint slide
- #business milestone template
About the Product
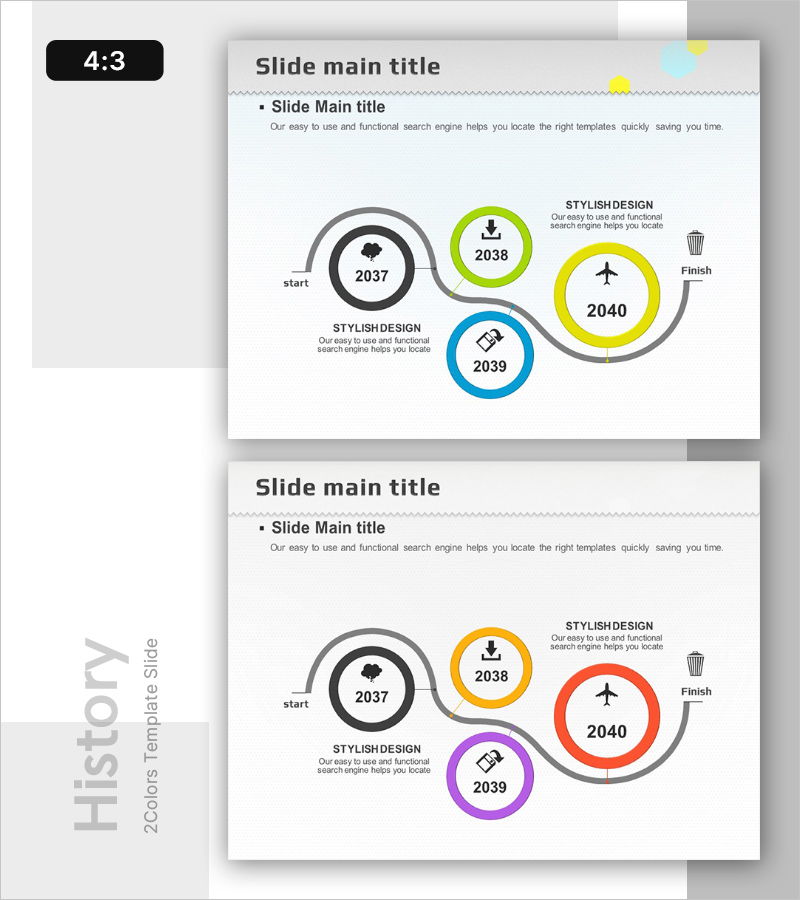
A 4-stage wave diagram PowerPoint slide that visualizes company history, project milestones, and business progression along a timeline. Four circular nodes (2037–2040) are arranged along a central wave line, each distinguished by vibrant colors including green, yellow, and blue. Icons and descriptive text can be added to each node to clearly communicate the flow of information and progression stages. Perfect for presenting company milestones, project phases, and business achievements. Delivered in 4:3 aspect ratio with 2 slides ready for immediate use.
Usage Points
-
Main Usage
Ideal for presenting company history, project milestones, business phases, and product development timelines in chronological order. The wave-shaped connecting line emphasizes continuity and progression between stages, enhancing audience comprehension.
-
How to Use
Enter year, milestone name, and key achievements in each circular node. Replace icons to reflect the characteristics of each stage. Colors can be retained or customized to match corporate branding. Add detailed information in the text areas to adapt the slide to your presentation context.
-
Recommended For
Suitable for company history sections in corporate presentations, project timelines in business plans, milestone explanations in investor pitches, product development process presentations, and organizational change narratives. Also effective for executive briefings, investor meetings, and employee onboarding materials.
-
Slide Structure
Four circular nodes arranged along a central wave line. Each node features a distinct color (green, yellow, blue, gray) with year and icon inside. Descriptive text areas positioned to the right of each node allow for detailed information input about each stage.
Related Products
-

Major Growth Process History Slide
#Company Introduction #Business Management #Diagram
-

Round Square History Diagram – Visual Representation of Historical Flow
#Company Introduction #Business Management #Diagram
-

Key Achievement Timeline Diagram – Connecting Present and Future
#Company Introduction #Business Management #Diagram
-

Big Data Development Plan by Year Slide
#Company Introduction #Business Management #Diagram
