Ringer Shape Subdivided Column Graph for Global Trade Business Objectives
RJ0300090_25
- Last Update 05/14/2025
- File Size 0.3MB
- # of Slides 2
- File Format PPTX
- Slide Ratio 16:9
- Color
Keywords
- #Content-Based Slides
- #Design-Based Slides
- #Product/Service Introduction
- #Business Vision and Strategy
- #Diagram
- #Program Introduction
- #Business Goals
- #Cluster
- #Closed Cluster Diagram
- #16:9
- #vertical bar chart PowerPoint
- #4-item column graph slide
- #business objectives presentation
- #global trade template
- #data comparison chart PPT
About the Product
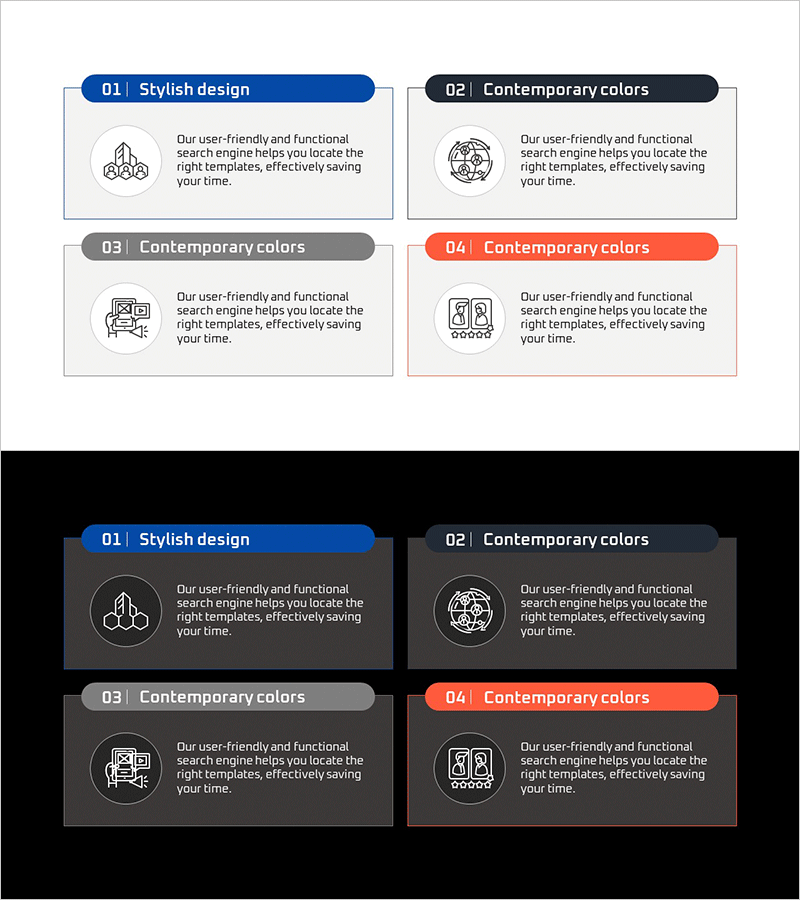
A vertical bar chart PowerPoint slide designed to visualize global trade and business objectives with four distinct data categories. The slide features color-coded bars in blue, black, gray, and orange, enabling effective numerical comparison and performance analysis across different business metrics. Provided in 2-slide 16:9 PPTX format, this template is ready for immediate editing and ideal for international trade presentations, market analysis, sales target reporting, and business performance reviews. Icons and organized layout enhance audience comprehension of complex data.
Usage Points
-
Main Usage
Visualize four key business metrics such as regional sales performance, quarterly revenue targets, product category comparisons, or international trade volumes using vertical bar charts. Enables clear numerical comparison and performance tracking across multiple business dimensions.
-
How to Use
Input numerical values into each bar chart and customize legend labels to match your presentation context. Two versions provided—light background and dark background—allowing you to select the appropriate design for your presentation environment.
-
Recommended For
International business professionals, marketing managers, sales directors, financial analysts, and business development teams presenting quarterly reports, regional performance analysis, target achievement reviews, and cross-border trade metrics.
-
Slide Structure
Four independent vertical bar charts arranged in a 2×2 grid layout. Each chart is distinguished by color-coded headers (blue, black, gray, orange) and accompanying icons. Includes two complete slide versions: light background and dark background for versatile use.
Related Products
-

How to Solve Insomnia Presentation Slide Template – Stress Relief
#Product/Service Introduction #Business Vision and Strategy #Diagram
-

Introduction to the Financial Business Program – A Differentiated Strategic Approach
#Product/Service Introduction #Business Vision and Strategy #Diagram
-

Business Objectives Square Diagram – Effective Strategy Formulation
#Product/Service Introduction #Business Vision and Strategy #Diagram
-

3D Printing Business Program Introduction Slide
#Product/Service Introduction #Business Vision and Strategy #Diagram
