Business Area Hexagon Diagram – Optimized for Business Introduction
RM0300002_13
- Last Update 02/07/2025
- File Size 4.2MB
- # of Slides 2
- File Format PPTX
- Slide Ratio 16:9
- Color
Keywords
- #Content-Based Slides
- #Design-Based Slides
- #Company Introduction
- #Business Introduction
- #Diagram
- #Business Areas
- #Business Areas
- #Cluster
- #Spread
- #Chain Diagram
- #Centralized Diagram
- #16:9
- #hexagon diagram PowerPoint
- #business area slide template
- #radial diagram PPT
- #company introduction presentation
- #business structure slide design
About the Product
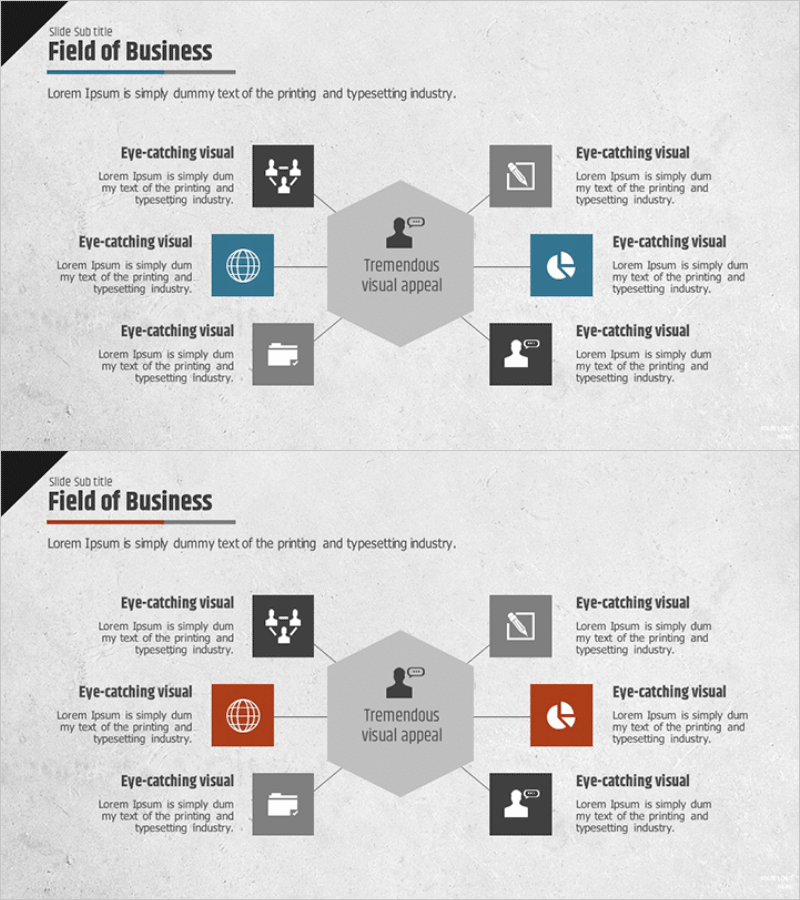
A PowerPoint slide featuring a central hexagon with six business areas arranged in a radial pattern around it. This presentation template is ideal for company introductions and business area explanations, allowing you to visually emphasize core business functions. Two layout variations are included: one with dark tones and another with color-accented highlights. Each area accommodates icons and text to clearly convey business characteristics. Available in 16:9 aspect ratio PPTX format for immediate editing.
Usage Points
-
Main Usage
Displays a company's core business divisions arranged around a central hexagon, enabling stakeholders to grasp the complete business portfolio at a glance. Suitable for business introductions, company overviews, organizational structure explanations, and multi-division portfolio presentations.
-
How to Use
Insert your company name or core message in the central hexagon, then add business unit names and descriptions in the six surrounding areas. Replace icons to visually represent each business division and adjust colors to match your brand identity and presentation theme.
-
Recommended For
Executive briefings, investor pitch meetings, employee onboarding sessions, and client proposal presentations where multiple business areas need clear visual representation. Particularly effective for diversified B2B companies and organizations with multiple revenue streams.
-
Slide Structure
Two-slide layout with dark background tones. First slide features gray and blue color accents; second slide uses red and orange highlights. Each slide contains one central hexagon node connected by lines to six surrounding hexagon nodes. Each node includes dedicated icon space and text input areas for customization.
Related Products
-

Astronomy Business Sector Diffusion Diagram
#Company Introduction #Business Introduction #Diagram
-

Mobile App Service Activity Area – Harmonizing Business and Design
#Company Introduction #Business Introduction #Diagram
-

Business Area Hexagon Diagram – Business Positioning
#Company Introduction #Business Introduction #Diagram
-

Cooperative Partner Business Areas Diagram
#Company Introduction #Business Introduction #Diagram
