Delivering Service Operation Plans with Mobile Network Configuration Diagram
RJ0400062_14
- Last Update 06/04/2025
- File Size 0.2MB
- # of Slides 2
- File Format PPTX
- Slide Ratio 16:9
- Color
Keywords
- #Content-Based Slides
- #Design-Based Slides
- #Technical Approach
- #Diagram
- #Service Operation Plan
- #System Architecture Diagram
- #Flow
- #Cluster
- #Chain Diagram
- #16:9
- #radial diagram PowerPoint
- #network topology slide
- #4-node diagram template
- #mobile network architecture PPT
- #technology architecture diagram
- #service operation structure
About the Product
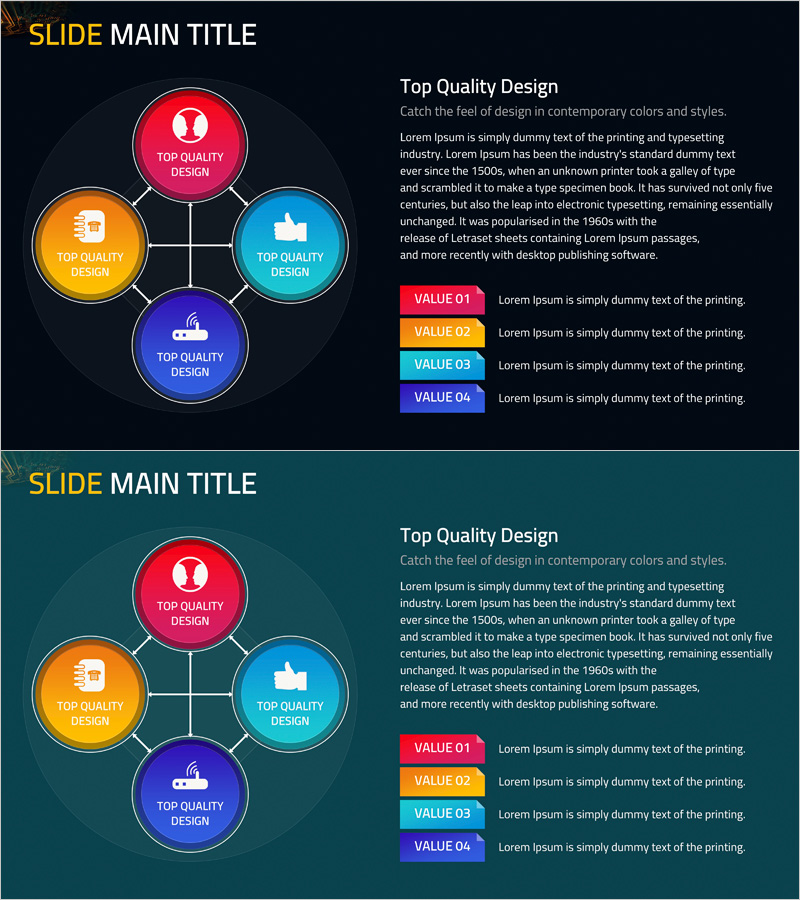
A radial network diagram PowerPoint slide with a central hub connected to four key nodes in a spoke pattern. Four circular nodes in red, orange, blue, and purple are linked to the center icon with connecting lines, effectively visualizing mobile service operations, technology architecture, and network topology. The 2-slide set features dark backgrounds (black and teal) with high-contrast colors for maximum presentation impact. Each node includes an icon and text area to clearly communicate service components, operational strategies, and technical stacks. Provided in fully editable PPTX format.
Usage Points
-
Main Usage
Visualize mobile service operations, technology architecture, network topology, and system components using a central hub radial structure to clearly communicate relationships between core elements and surrounding components.
-
How to Use
Use in technology presentations, service planning reports, and IT system introduction slides as a network configuration diagram. Edit node text and icons to input actual service components, operational departments, and technical stacks for immediate deployment.
-
Recommended For
IT technical teams, system engineers, service planners, and network operations managers presenting complex system structures in technical meetings, executive reports, and customer presentations.
-
Slide Structure
2-slide set. Each slide features a central icon with four circular nodes connected by lines in a radial pattern. Nodes are differentiated by color (red, orange, blue, purple) and icons, with text input areas below each node. Dark backgrounds (black or teal) support high-contrast visualization.
Related Products
-

Gardening Flow Connection Diagram – Service Setup Plan
#Technical Approach #Diagram #Service Implementation Plan
-

Business Process Diagram – Communication Flow
#Operational Plan #Technical Approach #Diagram
-

Blue Line Wide Template Directional Diagram
#Business Management #Technical Approach #Diagram
-

Business Process Visualization Diagram Slide
#Operational Plan #Technical Approach #Diagram
