Competitive Advantage Area Graph – A Powerful Tool for Market Analysis
RJ0400061_27
- Last Update 06/03/2025
- File Size 0.3MB
- # of Slides 2
- File Format PPTX
- Slide Ratio 16:9
- Color
Keywords
- #Content-Based Slides
- #Design-Based Slides
- #Market and Competitor Analysis
- #Diagram
- #Other
- #Market Analysis
- #Competitive Advantage
- #16:9
- #competitive advantage area graph PowerPoint
- #stacked area chart slide
- #market analysis graph PPT
- #how to visualize competitive positioning in PowerPoint
- #business strategy presentation slide
About the Product
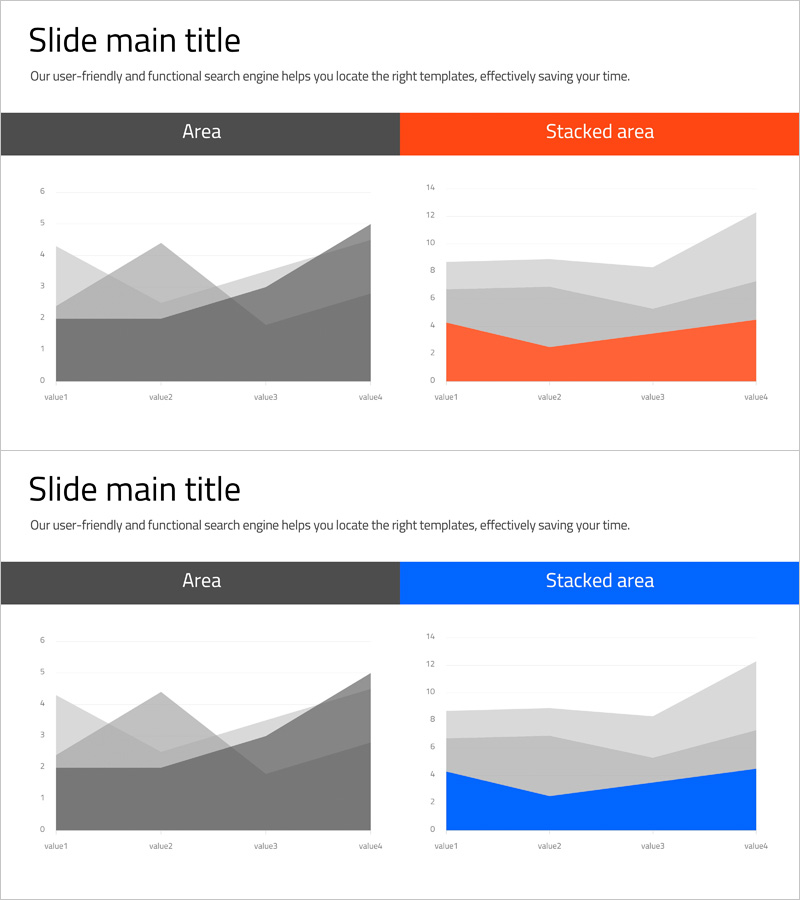
A PowerPoint slide featuring stacked area charts designed to visualize market analysis and competitive positioning strategies. This 2-slide set includes a neutral gray-tone version and accent versions in orange and blue, each with dedicated title and subtitle areas plus capacity for 4 data points. The stacked area graph format enables simultaneous comparison of multiple data layers, making it ideal for presenting market share, competitor benchmarking, revenue trends, and growth trajectories. Optimized for 16:9 widescreen format, all colors and numerical values are fully editable to match your presentation needs.
Usage Points
-
Main Usage
This slide supports data-driven decision-making during market analysis and competitive strategy development. The stacked area format simultaneously compares market share, growth rates, or revenue structures across competitors or business units, clearly communicating competitive positioning to investors, executives, and partners.
-
How to Use
Insert into the market analysis section of business plans, investor presentations, or strategic reports. Replace sample data with actual figures (market size, share percentages, growth rates), update title and legend text, and the slide is ready for presentation. Use the gray version for conservative reports and orange/blue versions for dynamic pitches.
-
Recommended For
Strategy planning teams, marketing departments, finance teams, and executives presenting competitive analysis results. Particularly effective when explaining new market entry, strategic repositioning, or competitive differentiation. Widely used by consulting firms, financial institutions, and corporate strategy divisions.
-
Slide Structure
Each slide features a title and subtitle area at the top (fully editable) with a stacked area graph below. The graph displays 4 data points (value1–value4) on the X-axis and 3–4 stacked data layers on the Y-axis, color-coded for distinction. Both slides share identical structure with color variations only.
Related Products
-

Sensuous Cloud Presentation Template with World Map
#Market and Competitor Analysis #Diagram #Other
-

Global Real Estate Market Analysis – Innovative Technology and Market Trends
#Technical Approach #Market and Competitor Analysis #Diagram
-

Visualizing Market Analysis and Performance with Reading Learning Table Charts
#Market and Competitor Analysis #Financial Plans and Performance #Diagram
-

Business Note Analysis Circle Graph & Table – Market and Competitive Analysis
#Market and Competitor Analysis #Diagram #Graph
