Current Status of Mobile Application Development Slide
RJ0400060_10
- Last Update 06/03/2025
- File Size 1.4MB
- # of Slides 2
- File Format PPTX
- Slide Ratio 16:9
- Color
Keywords
- #Content-Based Slides
- #Design-Based Slides
- #Product/Service Introduction
- #Business Vision and Strategy
- #Graph
- #Other
- #Development Status
- #Business Goals
- #16:9
- #mobile app development status PPT
- #development progress rate PowerPoint slide
- #business goal achievement infographic
- #project progress PPT
- #how to show development status in PowerPoint
About the Product
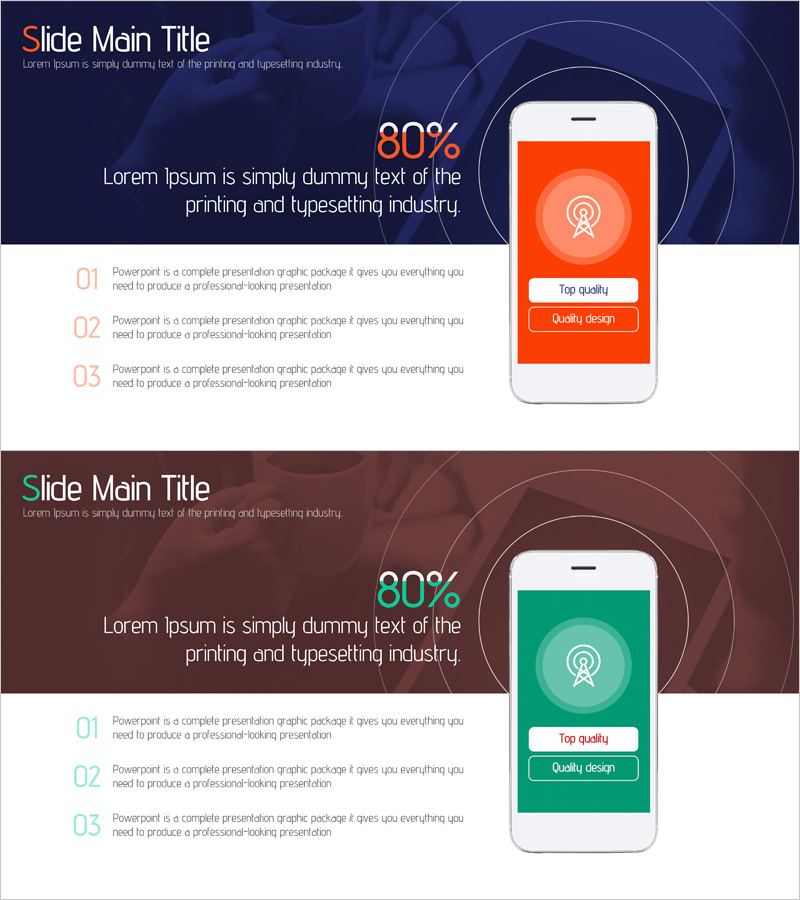
A PowerPoint slide that visually communicates mobile application development progress and achievement metrics. Featuring a dark blue background with orange and green accent colors across 2 slides, the design displays an 80% achievement rate using a circular gauge with a smartphone mockup positioned on the right. The left side includes 3 text input areas for adding development stage descriptions. This presentation slide is ready to use for project status updates, development milestone reporting, and business objective achievement presentations.
Usage Points
-
Main Usage
Clearly communicate mobile application development project progress and achievement rates to executives, investors, and team members. The circular gauge combined with numerical data (80%) enables stakeholders to understand project status at a glance.
-
How to Use
Use in the 'Business Objectives' section of business plans, quarterly progress reports, investor pitch decks, and project milestone presentations. Add development stage descriptions (planning, design, development, testing) in the left text areas to provide detailed context.
-
Recommended For
Ideal for IT and software development companies' executive reporting, startup investor presentations, project manager status updates, and development team milestone achievement announcements. Suitable for mobile app development, web service development, and SaaS project progress sharing.
-
Slide Structure
2-slide layout with the first slide featuring a dark blue background, 80% circular gauge, center text area, and smartphone mockup on the right. Three numbered text input areas (01, 02, 03) on the left allow adding development stage explanations. The second slide uses the same layout with green color for comparison or additional information display.
Related Products
-

Data Analysis Status Pie Chart – A Tool for Clear Understanding
#Product/Service Introduction #Graph #Other
-

Carbon Neutral Infographic Eco-Friendly Battery Chart – Modern Technology and Sustainability
#Product/Service Introduction #Business Introduction #Graph
-

Target Market Analysis Graph – Visualized Data Insights
#Product/Service Introduction #Market and Competitor Analysis #Graph
-

User Analysis Status by Year – Growth and Change
#Product/Service Introduction #Market and Competitor Analysis #Graph
