Development Status Analysis Graph – Visualizing Market Share
RJ0400059_9
- Last Update 06/03/2025
- File Size 0.9MB
- # of Slides 2
- File Format PPTX
- Slide Ratio 16:9
- Color
Keywords
- #Content-Based Slides
- #Design-Based Slides
- #Product/Service Introduction
- #Market and Competitor Analysis
- #Graph
- #Development Status
- #Market Share
- #Circles
- #Doughnut Chart
- #16:9
- #donut chart PowerPoint
- #pie chart slide template
- #percentage data visualization
- #market share graph
- #progress rate PPT slide
About the Product
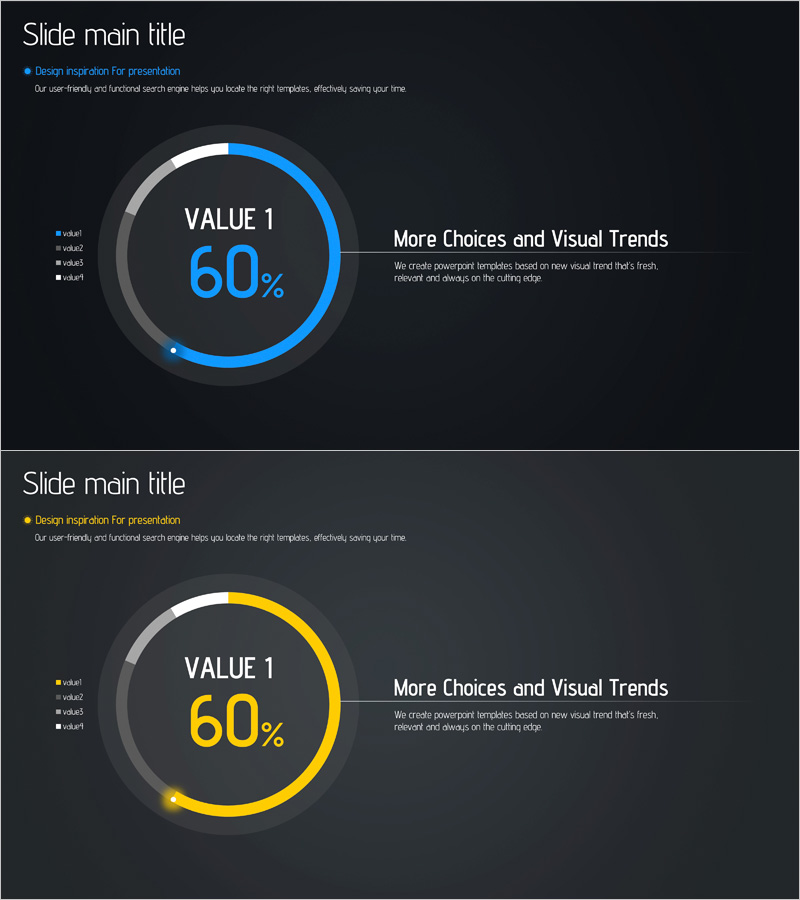
A professional donut chart PowerPoint slide template for visualizing single-metric percentages such as market share, project completion rates, and performance achievement. This 2-slide set features a dark background with blue and yellow accent colors, displaying percentage values at the center and descriptive text on the right. Ideal for business reports, market analysis presentations, and project status updates where data-driven insights need clear visual emphasis. The 16:9 widescreen PPTX format allows instant editing—simply modify the percentages, labels, and legend items to match your specific data and reuse across multiple presentations.
Usage Points
-
Main Usage
Presents single-metric ratios and composition percentages in an instantly recognizable donut chart format. Central percentage emphasis highlights key data, while the right-side text area provides supporting context, maximizing information clarity and audience comprehension.
-
How to Use
Apply to market analysis presentations to show competitive market share, project reports to display completion or achievement rates, and financial presentations to illustrate revenue composition. Replace legend items and percentage values with your own data for immediate use.
-
Recommended For
Marketing professionals, project managers, financial analysts, and executives presenting quantitative results and market conditions. Particularly effective when simple, unambiguous percentage representation is required for stakeholder communication.
-
Slide Structure
Two-slide set with each slide featuring a centered donut chart (single metric with 60% sample value), left-side legend (4 items), and right-side text box. Includes blue-accent and yellow-accent color variations for flexible design application.
Related Products
-

Financial Business Analysis Pie Chart – Market Share Insights
#Product/Service Introduction #Market and Competitor Analysis #Graph
-

Business Idea Development Status Graph – Ideas and Growth
#Product/Service Introduction #Market and Competitor Analysis #Graph
-

Analysis of Work Progress – Utilizing Pie Chart
#Product/Service Introduction #Market and Competitor Analysis #Graph
-

Space Exploration Donut Pie Chart
#Product/Service Introduction #Market and Competitor Analysis #Graph
