Learning Flow Across Five Key Areas - Multidirectional Tool
RB0300036_6
- Last Update 03/11/2025
- File Size 1MB
- # of Slides 2
- File Format PPTX
- Slide Ratio 4:3
- Color
Keywords
- #Content-Based Slides
- #Design-Based Slides
- #Business Introduction
- #Technical Approach
- #Diagram
- #Technological Status
- #System Architecture Diagram
- #Flow
- #Spread
- #Multidirectional Flow
- #4:3
- #multidirectional diagram PowerPoint
- #5-node flow chart slide
- #learning areas diagram
- #system architecture slide
- #radial connection diagram template
About the Product
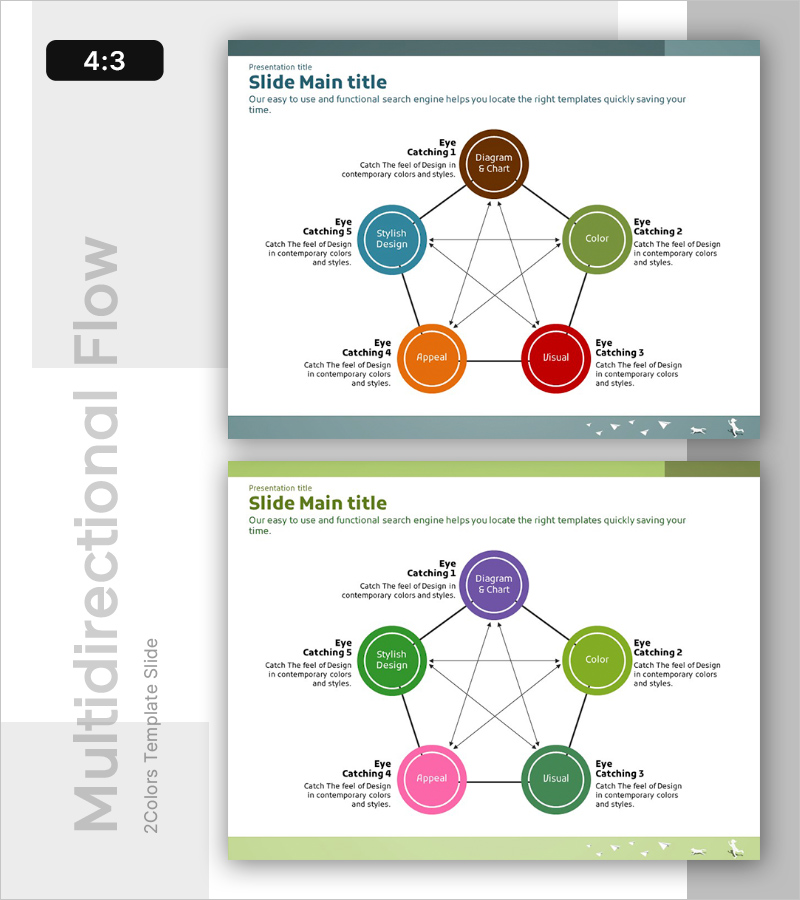
A multidirectional flow diagram PowerPoint slide featuring five key areas radiating from a central hub. The design uses five distinct colors—brown, teal, green, orange, and red—for the circular nodes, with interconnecting lines and arrows showing relationships between all areas. Each node includes space for descriptive text labels. This slide template is ideal for visualizing learning processes, technology system architectures, business domain analyses, and complex organizational structures. The 4:3 aspect ratio, 2-slide set is fully editable and ready for immediate use in presentations.
Usage Points
-
Main Usage
This multidirectional diagram visually represents the relationships and interactions among five key areas or components. The radial structure emanating from a central hub emphasizes interconnectedness and mutual influence between all elements. It effectively communicates learning domain structures, technology system components, business strategy pillars, or organizational frameworks where multiple areas interact simultaneously.
-
How to Use
Use this slide when explaining complex relationships in presentations. Set the central node as your main topic and the five surrounding nodes as key areas or components. Add descriptive text next to each node to explain its role. The color-coded nodes help audience members distinguish between different areas, while the connecting lines and arrows clarify relationships and dependencies between elements.
-
Recommended For
Technology professionals presenting system architecture, educators explaining learning domain structures, management consultants presenting business frameworks, researchers categorizing research areas, organizational development specialists describing competency models, and project managers illustrating cross-functional team structures. Suitable for any presentation requiring clear visualization of multiple interconnected elements.
-
Slide Structure
Central brown circular node (Diagram & Chart) surrounded by five colored nodes (teal, green, orange, red, purple) arranged in radial pattern. Each node connects to the center and adjacent nodes via bidirectional arrows and lines. Text labels and descriptive areas are positioned around each node. The 2-slide set offers alternative color combinations for visual variety and emphasis.
Related Products
-

Business Operation Management Plan – Latest Technology System Diagram
#Business Introduction #Technical Approach #Diagram
-

Service Development Item Classification Diagram – Efficient Business Management
#Business Management #Technical Approach #Diagram
-

Development Status by Technology Diagram Slide - Core Information
#Product/Service Introduction #Business Introduction #Diagram
-

Architectural Illustration Circular Diagram – Latest Technology Status
#Business Introduction #Technical Approach #Diagram
