Competitor Breakdown Analysis Graph
RJ0400057_21
- Last Update 06/02/2025
- File Size 0.9MB
- # of Slides 2
- File Format PPTX
- Slide Ratio 16:9
- Color
Keywords
About the Product
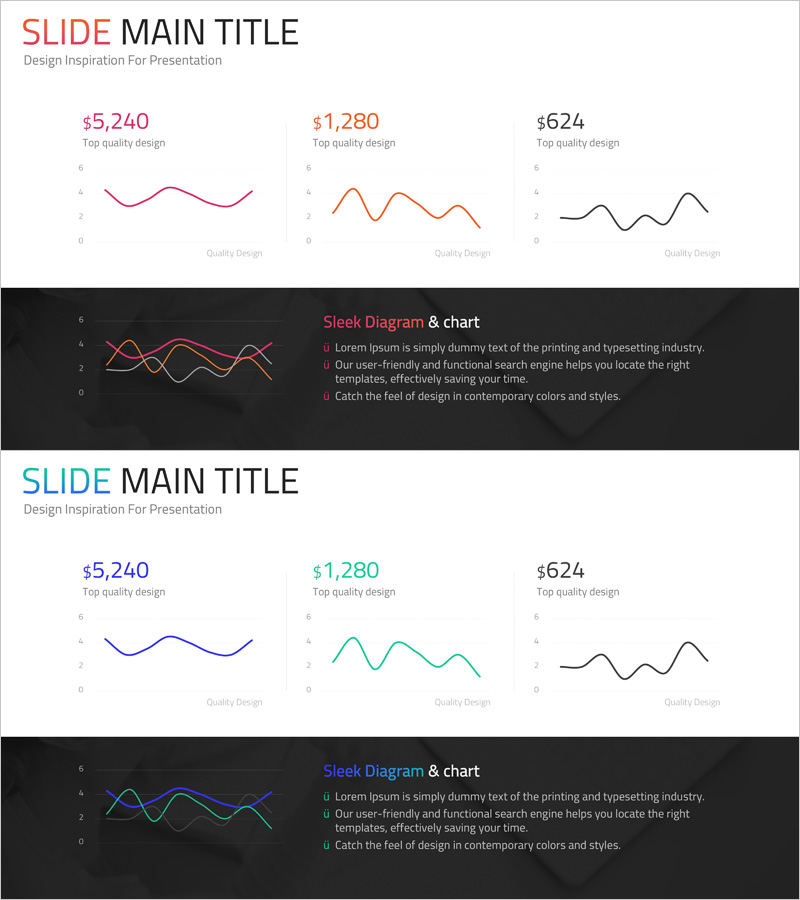
A 2-slide PowerPoint presentation set for visualizing competitive analysis and market trends. Multiple line graphs enable simultaneous comparison of competitor performance metrics, with price information sections at the top and a dark background diagram area at the bottom. Data visualization using orange, pink, and black lines clearly communicates competitive positioning in presentations and reports. Designed in 16:9 widescreen format optimized for modern projectors and digital displays, fully editable in PPTX format for immediate customization.
Usage Points
-
Main Usage
Compare multiple competitor performance metrics, market share, and sales trends simultaneously. Line graph trends reveal competitive advantages and market opportunities at a glance, enabling persuasive market positioning communication to investors, executives, and partners.
-
How to Use
Enter competitor names and key metrics in the top price information boxes, then modify line graph data points with actual figures. Add analysis findings, insights, and strategic implications to the bottom dark background section to support data-driven decision-making.
-
Recommended For
Strategic planning, marketing, and sales team market analysis presentations; executive reports; investment pitch decks; competitive benchmarking reports; quarterly and annual performance analysis presentations.
-
Slide Structure
2-slide layout: Slide 1 features three price information boxes at top and multi-line graph area below; Slide 2 has dark background with title, diagram, and three bullet-point text items. Five text input areas (3 prices + 1 title + 3 bullets), comparative data structure with simultaneous multi-line display.
Related Products
-

Grouped Bar Chart for Learning Categories
#Market and Competitor Analysis #Graph #Competitor Analysis
-

SEO System Comparison Analysis Bar Graph
#Market and Competitor Analysis #Graph #Competitor Analysis
-

Business Meeting Results Analysis Graph
#Market and Competitor Analysis #Graph #Competitor Analysis
-

Visualizing Bar Graphs with PC Mockups – Competitive Market Analysis Tool
#Market and Competitor Analysis #Graph #Other
