Gradient Analysis Bar Graph – Optimized for Market and Competitor Analysis
RJ0400057_14
- Last Update 06/02/2025
- File Size 0.1MB
- # of Slides 2
- File Format PPTX
- Slide Ratio 16:9
- Color
Keywords
About the Product
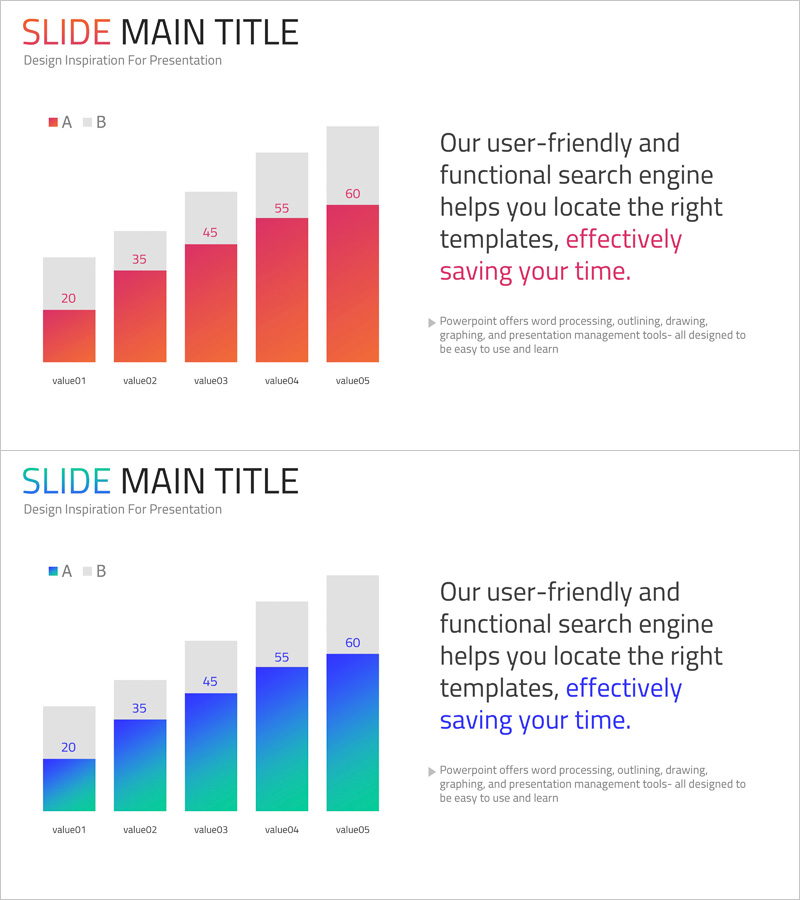
A vertical bar chart PowerPoint slide optimized for market analysis and competitor comparison. The gradient color transitioning from red to orange visually represents five data points with intuitive clarity. Gray background bars provide contrast to emphasize actual values, with numerical labels (20, 35, 45, 55, 60) clearly displayed above each bar. The right side includes a text area for additional analysis commentary. This 2-slide set is ready for immediate use in presentations and business reports.
Usage Points
-
Main Usage
Compare five numerical data points such as market size, competitor performance, sales volume, or customer satisfaction ratings. The gradient color scheme visually emphasizes data trends and increases audience comprehension during presentations.
-
How to Use
Bar height and color intensity represent data magnitude, while the right text area accommodates analysis findings or insights. Edit colors, values, and labels directly in the slide master to customize the chart for your specific dataset.
-
Recommended For
Marketing managers, strategy planners, sales leaders, and executives preparing business reports. Ideal for business plans, quarterly performance reports, competitive analysis documents, and investor pitch presentations.
-
Slide Structure
2-slide set. First slide features red-gradient 5-step bars; second slide offers teal-gradient 5-step bars for color variation. Each bar is independently adjustable in height, with data labels and legend included for easy customization.
Related Products
-

Vertical Bar Standard Color Chart for Market Analysis – Market and Competitor Analysis
#Market and Competitor Analysis #Graph #Competitor Analysis
-

Vertical Bar Graph for Market and Competitor Analysis – Professional Data Visuals
#Market and Competitor Analysis #Graph #Competitor Analysis
-

Comparative Analysis Vertical Bar Graph for Market Insights
#Market and Competitor Analysis #Graph #Other
-

Pie & Bar Analysis Graphs – Optimized for Market and Competitor Analysis
#Market and Competitor Analysis #Graph #Competitor Analysis
