Circular Diagram by Year – Cluster and Connection
RJ0400054_4
- Last Update 06/01/2025
- File Size 2.3MB
- # of Slides 2
- File Format PPTX
- Slide Ratio 16:9
- Color
Keywords
About the Product
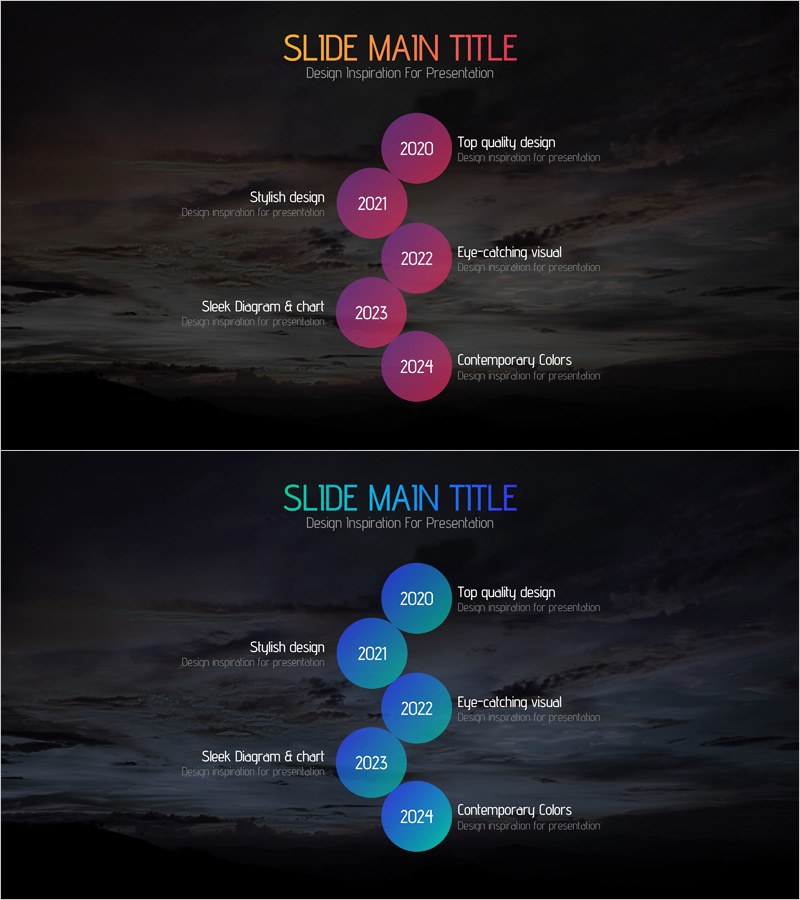
A PowerPoint slide featuring a 5-node circular diagram to visualize year-by-year progression, company milestones, and project timelines from 2020 to 2024. Circular nodes in magenta and blue tones are arranged diagonally with text areas beside each node for detailed descriptions. Optimized for 16:9 widescreen format with 2-slide composition, this presentation template is ready to use in company profile decks, annual reports, and business development slides. The diagram effectively communicates temporal flow and sequential achievements through intuitive visual representation.
Usage Points
-
Main Usage
Represents year-by-year progression, company development stages, and project timelines using 5 circular nodes. Each node corresponds to a specific year or phase, with accompanying text areas to highlight key achievements, events, and milestones in chronological order.
-
How to Use
Insert into company history sections of corporate presentations, timeline slides in annual reports, and project status updates. Edit node text to add years, phase names, and key accomplishments. Customize node colors to emphasize specific stages or achievements as needed.
-
Recommended For
Executives, marketing teams, project managers, and business development professionals presenting company history, performance metrics, and project progress. Suitable for investor presentations, quarterly business reviews, and employee onboarding materials.
-
Slide Structure
5 circular nodes arranged diagonally with magenta and blue fill colors. Each node displays a year (2020–2024) at center with adjacent text boxes for descriptions. Connection lines between nodes indicate progression flow. Two color variations (magenta tone and blue tone) provided across 2 slides.
Related Products
-

History Overlay Diagram – Company Introduction Slide
#Company Introduction #Diagram #History
-

Introduction to the History of the Architectural Company – A Visual Timeline
#Company Introduction #Diagram #Company Overview
-

Business History Connection Diagram – Company Growth Story
#Company Introduction #Diagram #History
-

History Flag Shape Diagram - Company Growth and Vision
#Company Introduction #Diagram #History
