Big Data Illustration History Diagram – Experience Innovation through Data Visualization
RJ0400053_5
- Last Update 06/01/2025
- File Size 0.2MB
- # of Slides 2
- File Format PPTX
- Slide Ratio 16:9
- Color
Keywords
About the Product
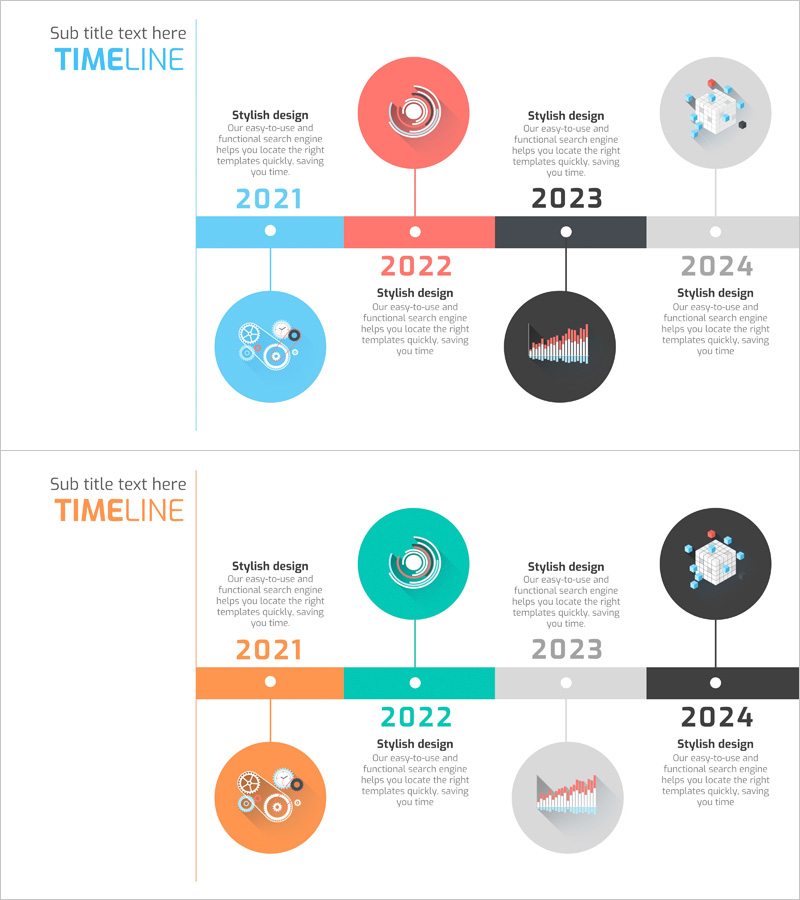
A connected timeline diagram PowerPoint slide that visually represents business milestones and data-driven innovation across four key nodes. This 2-slide PPTX template features a central horizontal timeline with four circular nodes positioned alternately above and below, each containing an icon and editable text area. Perfect for presenting company history, product development roadmaps, business growth phases, or technology evolution. The colorful node design (red, blue, orange, black) combined with a neutral background creates strong visual impact while maintaining professional clarity for executive presentations, investor pitches, and strategic planning sessions.
Usage Points
-
Main Usage
Display chronological progression of major events, milestones, or project phases through a central timeline connecting four key nodes. Each node's icon and text area emphasize critical information, enabling audiences to quickly grasp the sequence and significance of business developments or technological advancements.
-
How to Use
Use in company history presentations, product roadmap explanations, business growth stage overviews, or technology innovation timelines. Edit each node's text and icon to match your content, then arrange information chronologically along the timeline for maximum clarity and engagement.
-
Recommended For
Ideal for executives, business strategists, marketing professionals, product managers, and technical leaders presenting to boards, investors, new employees, or stakeholders. Suitable for annual reports, investor relations, organizational development, and strategic planning presentations.
-
Slide Structure
2-slide layout with central horizontal timeline. Four circular nodes (approximately 80px diameter) alternate above and below the timeline. Each node contains a centered icon area and editable text field above. Connection lines and year/phase labels are positioned along the timeline for clear chronological sequencing.
Related Products
-

Spade Shape Theme History Diagram – Emphasizing Company Development
#Company Introduction #Diagram #History
-

Introduction to the History of the Architectural Company – A Visual Timeline
#Company Introduction #Diagram #Company Overview
-

History Folder Shape Diagram - Optimized for Company Introduction
#Company Introduction #Product/Service Introduction #Diagram
-

Fountain Pen History Diagram – Emphasizing Corporate Identity
#Company Introduction #Product/Service Introduction #Diagram
