VR System Development Status Analysis Graph – Visualization of Market Share
RJ0400050_15
- Last Update 05/31/2025
- File Size 1.9MB
- # of Slides 2
- File Format PPTX
- Slide Ratio 16:9
- Color
Keywords
About the Product
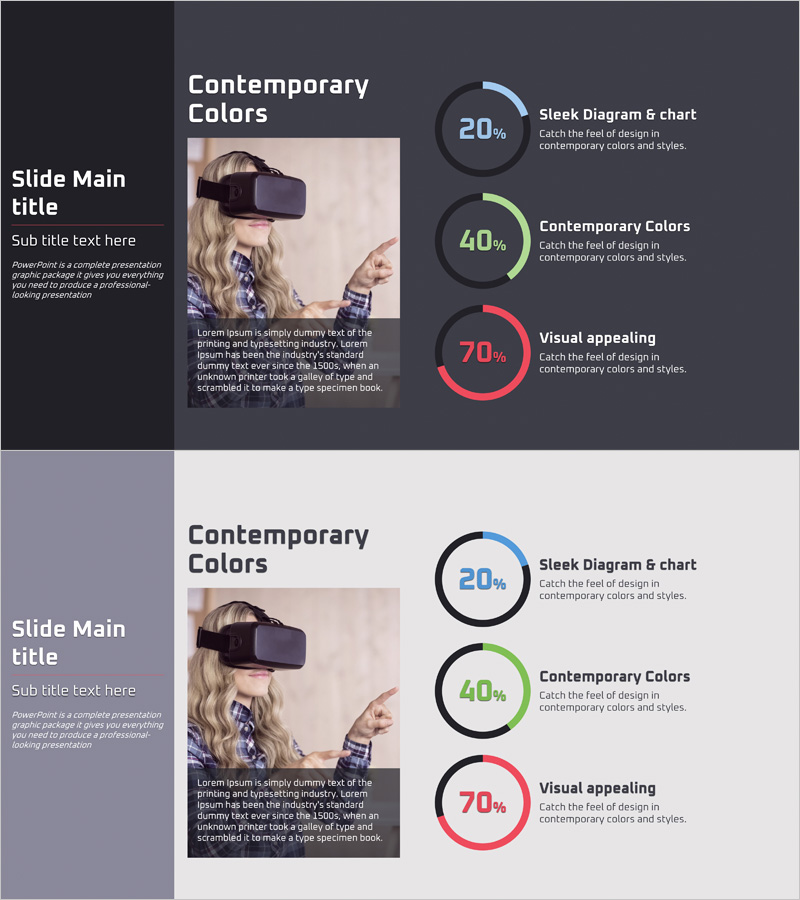
A donut-shaped pie chart PowerPoint slide that visualizes VR system development status and market share across three key segments. The design features a dark gray background with blue, green, and red accent colors representing each segment's proportion (20%, 40%, 70%), with an editable center area for additional text or metrics. Two layout variations—dark tone and light tone—are included, allowing you to match your presentation's color scheme. The 2-slide template is ready for immediate use in technical presentations, market analysis reports, and performance reviews.
Usage Points
-
Main Usage
Displays market share, development progress, or user distribution across three categories using a donut-shaped pie chart. The center area can be customized with key metrics or titles to emphasize critical data points and improve visual hierarchy.
-
How to Use
Insert into the data visualization section of technical presentations, product pitches, or market analysis reports. Double-click chart segments to edit percentages and colors; update legend labels to match your presentation context. Use the dark tone version for professional corporate settings and the light tone for modern, approachable presentations.
-
Recommended For
Ideal for IT and technology companies presenting development status, VR/AR solution providers showcasing market analysis, startups preparing investor pitch decks, technical conference presentations, and quarterly performance reports. Recommended for engineers, product managers, and marketing professionals communicating data-driven insights visually.
-
Slide Structure
2-slide set: Slide 1 features a dark gray background with a 3-segment donut chart (blue 20%, green 40%, red 70%); Slide 2 presents the same chart structure on a light background. Each segment includes adjacent label text areas, and the center circle is fully editable for custom content. 16:9 widescreen format, PPTX file type compatible with all PowerPoint versions.
Related Products
-

Financial Business Analysis Pie Chart – Market Share Insights
#Product/Service Introduction #Market and Competitor Analysis #Graph
-

Business Idea Development Status Graph – Ideas and Growth
#Product/Service Introduction #Market and Competitor Analysis #Graph
-

City Theme Market Share Graph – Business Data Visualization
#Product/Service Introduction #Market and Competitor Analysis #Graph
-

Analysis graph of market share progress
#Product/Service Introduction #Market and Competitor Analysis #Graph
