Target Country Market Share Map Graph – Insights for Market Analysis
RJ0400049_7
- Last Update 05/30/2025
- File Size 0.3MB
- # of Slides 2
- File Format PPTX
- Slide Ratio 16:9
- Color
Keywords
- #Content-Based Slides
- #Design-Based Slides
- #Market and Competitor Analysis
- #Marketing Plan and Strategy
- #Graph
- #Other
- #Target Market
- #Target Market Strategy
- #Map
- #16:9
- #target country map PowerPoint slide
- #market share comparison PPT
- #geographic data visualization
- #country-by-country analysis slide
- #global market analysis presentation
About the Product
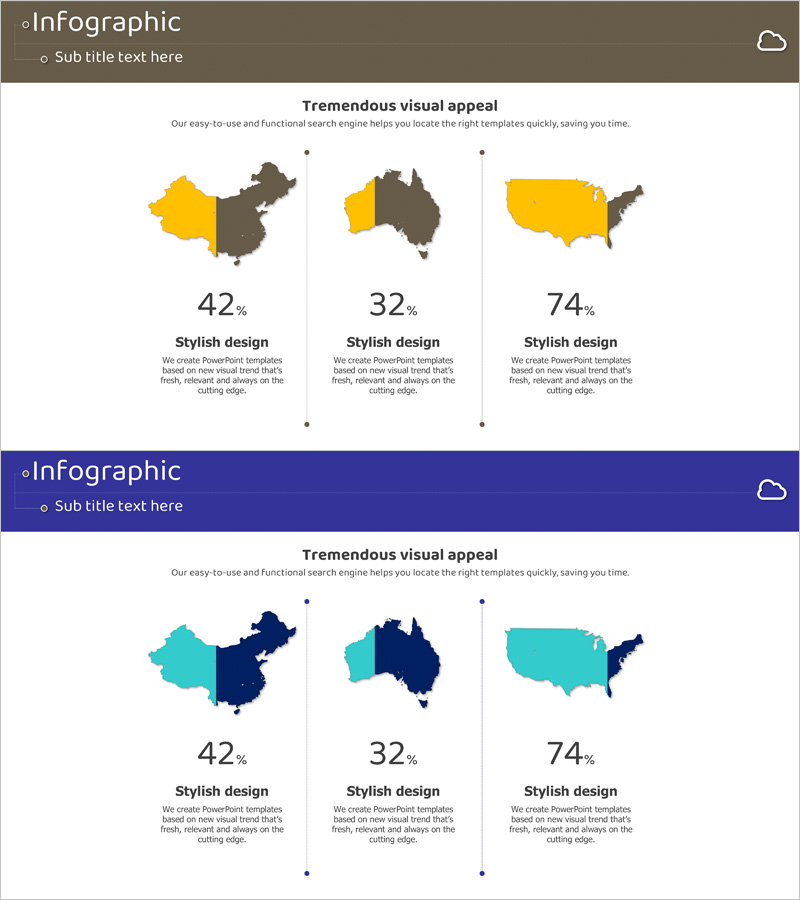
A map-based market share comparison PowerPoint slide designed for global market analysis presentations. This slide visualizes the market share of three target countries—China, Australia, and the United States—using color-coded geographic regions, with percentage figures and descriptive text for each country. Available in two color themes: gold and brown contrast, or teal and navy dual-tone layout, enabling intuitive country-by-country data comparison. The 2-slide set is optimized for 16:9 widescreen format. Ideal for investor pitches, market entry strategies, and executive briefings to communicate regional performance at a glance.
Usage Points
-
Main Usage
Visualizes market share, performance, and strategic positioning of specific countries on a global map, providing data-driven insights for decision-making. Communicates regional market conditions intuitively to investors, partners, and executives.
-
How to Use
Highlight target countries on the map using accent colors, then input percentage figures and descriptive text for each region. Choose between two color theme options that align with your corporate brand or presentation tone.
-
Recommended For
Suitable for market analysis, competitive benchmarking, regional revenue reporting, and global expansion strategy presentations. Effective in investor relations, business plans, marketing strategies, and executive reports emphasizing geographic data.
-
Slide Structure
Each slide contains one title and description text area, one map visualization zone, three country percentage figures, and three country-specific description text blocks. The comparative layout accommodates up to three countries' data simultaneously.
Related Products
-

Area Graph for Competitor Analysis
#Market and Competitor Analysis #Marketing Plan and Strategy #Graph
-

Dot Map Graph for Market Analysis Visualization – Strategic Approach
#Market and Competitor Analysis #Marketing Plan and Strategy #Graph
-

European Target Country Analysis Graph – Strategic Market Insights
#Market and Competitor Analysis #Marketing Plan and Strategy #Graph
-

Target Area Status Analysis Graph
#Market and Competitor Analysis #Marketing Plan and Strategy #Graph
