Country-by-Country Analysis Comparison Chart – Market and Competitor Analysis
RJ0300062_26
- Last Update 05/05/2025
- File Size 0.3MB
- # of Slides 2
- File Format PPTX
- Slide Ratio 16:9
- Color
Keywords
- #Content-Based Slides
- #Design-Based Slides
- #Market and Competitor Analysis
- #Marketing Plan and Strategy
- #Graph
- #Other
- #Target Market
- #Target Market Strategy
- #Column
- #Segmented Column
- #Map
- #16:9
- #world map PowerPoint slide
- #country analysis chart template
- #regional comparison presentation
- #Asia map slide download
- #market analysis slide template
About the Product
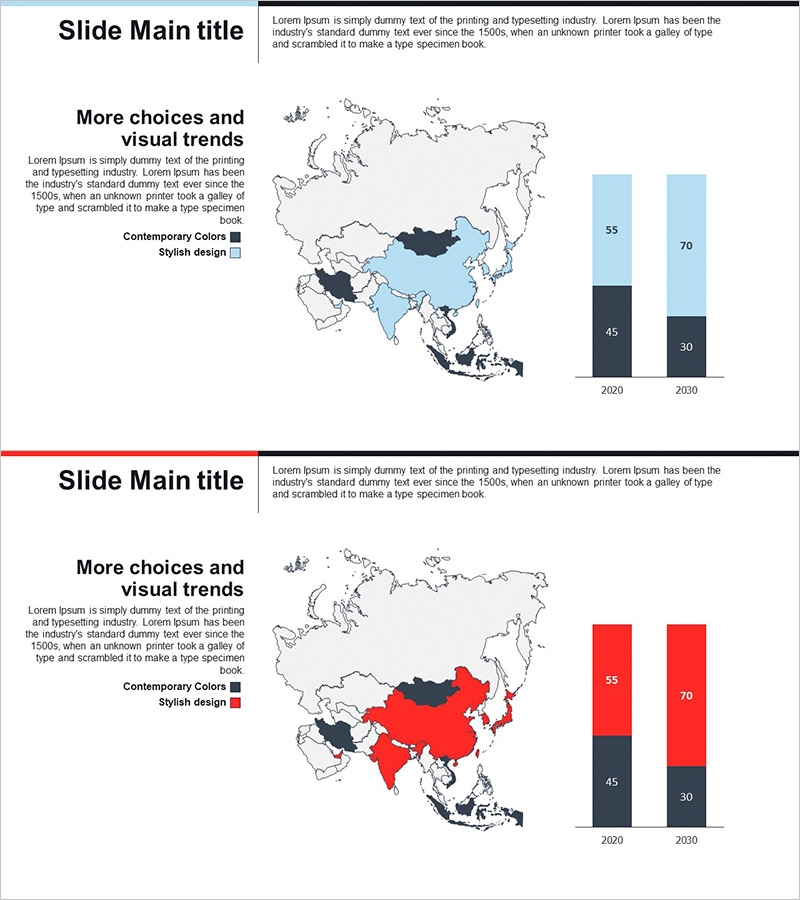
A PowerPoint slide template for comparing country-level data across Asia using visual mapping and data visualization. The design combines a geographic map on the left with stacked bar charts on the right, enabling simultaneous presentation of spatial information and numerical metrics. Two color schemes—blue tone and red tone—are included, with each slide structured to compare 2020 and 2030 data. Ideal for market analysis, competitive benchmarking, and regional performance reporting in business presentations.
Usage Points
-
Main Usage
Integrates geographic context with quantitative data by displaying country-level metrics on a map alongside comparative bar charts. Effectively communicates market size differences, regional performance variations, and global strategy implications through spatial and numerical alignment.
-
How to Use
Highlight target countries on the left-side Asia map using color coding, then input corresponding year-over-year data into the right-side stacked bar charts. Position 2020 and 2030 data side-by-side to visualize trends and growth trajectories across regions.
-
Recommended For
Marketing professionals presenting market entry strategies, executives reporting regional business performance, consultants analyzing global market dynamics, and investors evaluating geographic expansion plans. Suitable for international business reports, regional economic analysis, and global marketing strategy documents.
-
Slide Structure
2-slide set. Each slide features an Asia map on the left (country borders, color-coded emphasis regions) paired with stacked bar charts on the right (2 data series, 4–5 countries per year, comparing 2020 vs. 2030). Includes blue tone (dark navy, light blue) and red tone (dark charcoal, bright red) color variants.
Related Products
-

Asia Target Market Analysis Graph – Visualizing Market Strategy
#Market and Competitor Analysis #Marketing Plan and Strategy #Graph
-

Graph of the Status of European Target Region Analysis – Market Trends Visualization
#Market and Competitor Analysis #Marketing Plan and Strategy #Graph
-

Map of Major Target Areas in the United States – Market Analysis and Marketing Strategy
#Market and Competitor Analysis #Marketing Plan and Strategy #Other
-

U.S. Target Region Distribution – Market Analysis
#Market and Competitor Analysis #Marketing Plan and Strategy #Graph
