Introducing IoT Service Program with Diagrams – Modern Visual Presentation
RJ0400049_27
- Last Update 05/30/2025
- File Size 0.2MB
- # of Slides 2
- File Format PPTX
- Slide Ratio 16:9
- Color
Keywords
- #Content-Based Slides
- #Design-Based Slides
- #Product/Service Introduction
- #Diagram
- #Program Introduction
- #Product and Service Overview
- #Cluster
- #Closed Cluster Diagram
- #16:9
- #closed cluster diagram PowerPoint
- #IoT service slide template
- #3-area connection diagram
- #service architecture PowerPoint slide
- #how to create cluster diagram in PowerPoint
- #interconnected system diagram template
About the Product
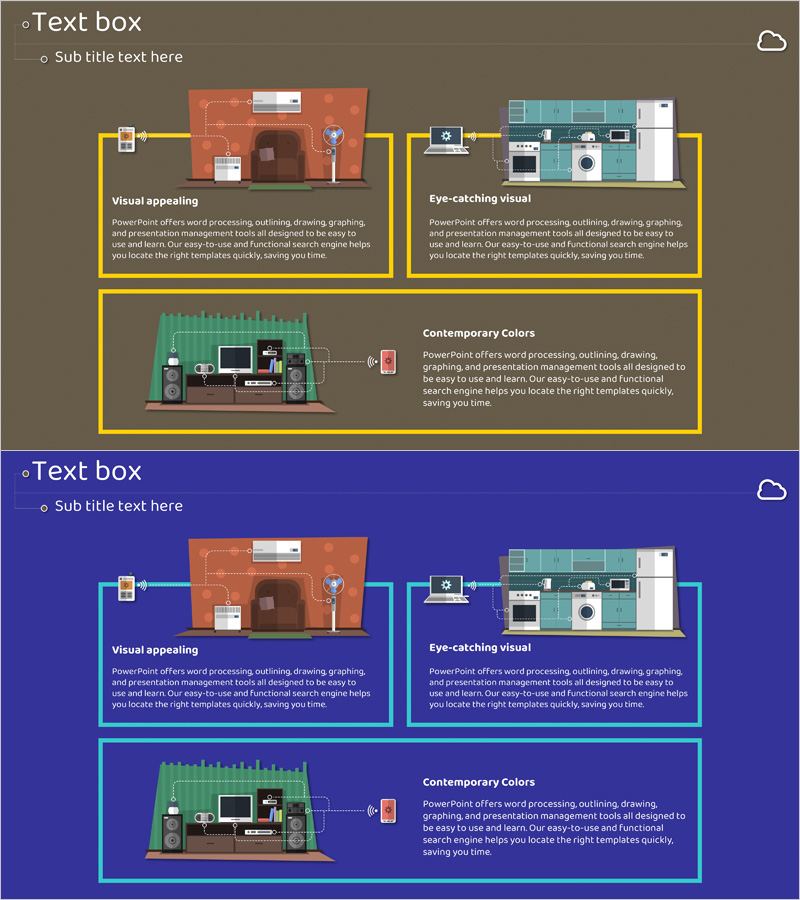
A closed-form cluster diagram PowerPoint slide that visualizes an IoT service program across three interconnected areas. Three colored boxes—orange, teal, and green—are connected by bidirectional arrows to show relationships, with icons and text describing functions within each area. The 2-slide set includes versions with tan and dark blue backgrounds (16:9 aspect ratio) for flexible presentation contexts. This design effectively communicates complex service architecture to audiences, making system relationships immediately clear and enhancing comprehension during technical or business presentations.
Usage Points
-
Main Usage
Clearly visualizes relationships between three interconnected service areas such as IoT platforms, smart devices, and cloud infrastructure. Icons and text labels distinguish each area's function and role, enabling audiences to grasp the complete service ecosystem at a glance.
-
How to Use
Use in program introduction, service architecture explanation, or technology platform overview sections. Edit box text and icons to match your specific services, and adjust background colors to align with corporate branding. Choose between tan or blue background versions based on presentation tone and audience context.
-
Recommended For
Ideal for IoT and smart technology companies presenting product overviews, IT solution proposals, technical seminars, and investor presentations. Engineers, technical marketers, and business development teams benefit when explaining complex system structures to non-technical audiences.
-
Slide Structure
2-slide set. Each slide features three closed-form boxes (orange, teal, green) connected by bidirectional arrows. Each box contains one icon, title, and descriptive text, with an additional information area at the bottom. 16:9 widescreen format, fully editable PPTX.
Related Products
-

3 Product Categories Slide – Stylish Design
#Product/Service Introduction #Diagram #Program Introduction
-

Introduction to the Appendix Program – Engaging Program Structure
#Product/Service Introduction #Diagram #Program Introduction
-

Medical Program Introduction Diagram – Effective Cluster Structure
#Product/Service Introduction #Diagram #Program Introduction
-

Shopping Mall Product Purchase Analysis – Insights Through Data Visualization
#Product/Service Introduction #Diagram #Program Introduction
