Analysis of Key Internet of Things Services – Technology Current Status and Structure
RJ0400049_17
- Last Update 05/30/2025
- File Size 0.2MB
- # of Slides 2
- File Format PPTX
- Slide Ratio 16:9
- Color
Keywords
- #Content-Based Slides
- #Design-Based Slides
- #Business Introduction
- #Technical Approach
- #Diagram
- #Graph
- #Technological Status
- #System Architecture Diagram
- #Cluster
- #Circles
- #Chain Diagram
- #Pie Chart
- #16:9
- #pie chart PowerPoint slide
- #circular diagram presentation
- #ratio analysis template
- #radial diagram design
- #IoT technology status slide
- #6-segment pie chart template
About the Product
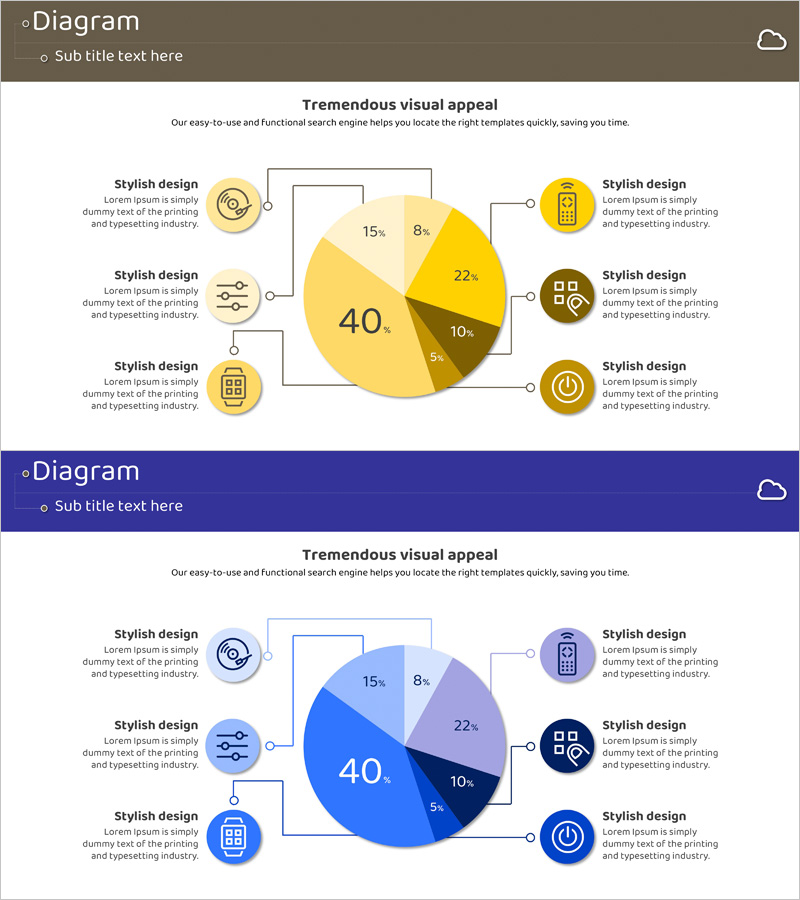
A radial diagram PowerPoint slide optimized for IoT service analysis and technology status presentations. The design features a central pie chart displaying six segments (40%, 22%, 15%, 10%, 8%, 5%) connected to six icon nodes positioned on the left and right sides. Two color versions—yellow and blue—are included, each with icon and text description areas for business analysis, system architecture, and technology overview applications. The 16:9 format includes 2 fully editable slides ready for immediate use.
Usage Points
-
Main Usage
Visualize complex IoT service data, technology status, and business structure analysis using a combined pie chart and radial node layout. The central pie chart provides instant ratio comprehension while surrounding icon nodes enable detailed item-by-item explanation in a dual-layer structure.
-
How to Use
Modify the central pie chart percentages and colors to match your data, then update the six surrounding node icons and text labels with corresponding items. Suitable for technology briefings, system architecture diagrams, business analysis, and market overview presentations across multiple industries.
-
Recommended For
Technology managers, business strategists, marketing professionals, consultants, and investment pitch presenters. Particularly effective for IoT, IT, telecommunications, and manufacturing sectors presenting technology status, new business analysis, and market research findings.
-
Slide Structure
Central pie chart (6 segments: 40%, 22%, 15%, 10%, 8%, 5%) with line-connected icon nodes—3 on left, 3 on right. Each node includes icon, title, and description text areas. Two color versions provided: yellow and blue variants.
Related Products
-

System Framework and Action Plan – Strategic Design Based on Diagrams
#Technical Approach #Diagram #Service Implementation Plan
-

4-Part Revenue Components Analysis – Core of Business Structure
#Business Introduction #Technical Approach #Diagram
-

Current Status of Smart City Mobile Technology Slide – Efficiency and Innovation
#Business Introduction #Technical Approach #Graph
-

Galaxy Theme Brain Structure Explanation Connection Diagram – Innovation and Insight
#Business Introduction #Diagram #Technological Status
