Business Achievement Goals Diagram – Market Analysis and Marketing Strategy
RJ0400048_18
- Last Update 05/30/2025
- File Size 0.8MB
- # of Slides 2
- File Format PPTX
- Slide Ratio 16:9
- Color
Keywords
- #Content-Based Slides
- #Design-Based Slides
- #Market and Competitor Analysis
- #Marketing Plan and Strategy
- #Graph
- #Other
- #Market Analysis
- #Marketing Objectives
- #Column
- #Column Chart
- #Mockup
- #16:9
- #circular diagram PowerPoint
- #center diagram slide template
- #3-step process diagram
- #business goal visualization
- #marketing strategy PowerPoint slide
About the Product
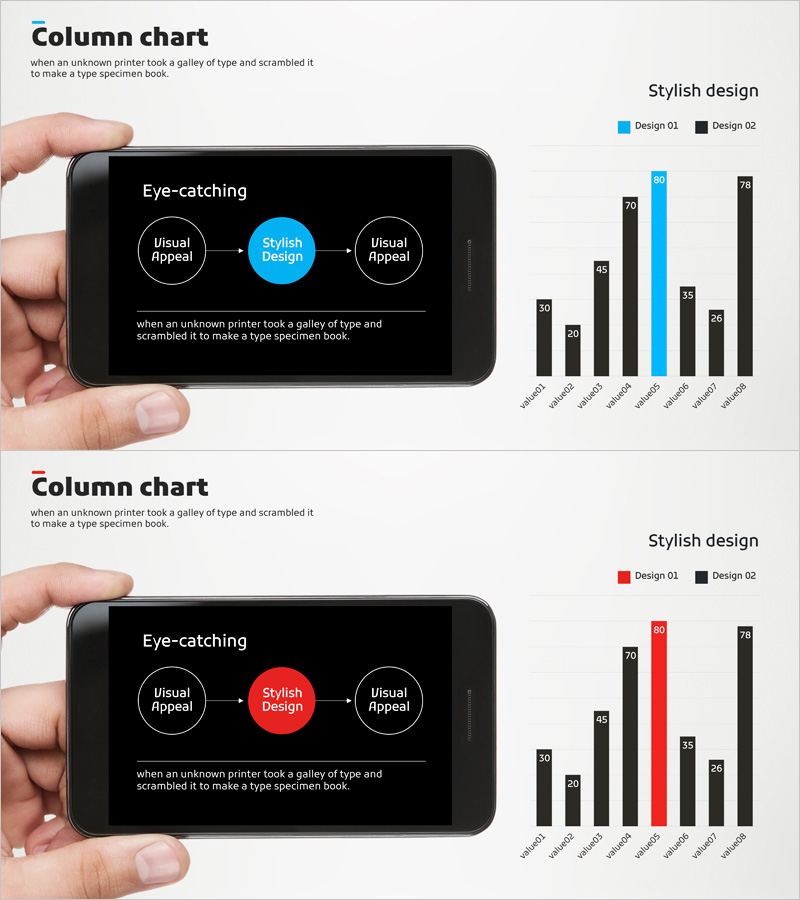
A circular center diagram PowerPoint slide that visualizes the core process for achieving business goals. The design features a central highlighted element with left and right connected stages, clearly expressing the market analysis and marketing strategy development process. Set against a black background with blue or red accent circles that stand out prominently, this slide effectively communicates data-driven decision-making flow. The 2-slide set offers various color combinations and is optimized for 16:9 widescreen format.
Usage Points
-
Main Usage
Visualizes the core process of business goal achievement in stages, providing clear understanding to audiences. Emphasizes the causal relationship between market analysis, strategy development, and execution, with the central element highlighting the key message.
-
How to Use
Use in executive reports, marketing planning presentations, and business plan explanations. Replace the central 'Stylish Design' element and surrounding nodes with your own content to customize the message flow.
-
Recommended For
Marketing managers, business planning teams, executives presenting reports, and consultants explaining strategy development processes. Ideal for presentations emphasizing 3-step processes or center-periphery relationships.
-
Slide Structure
Central circular accent element (blue or red) with two circular nodes positioned on each side. Each node includes text input areas and is connected by arrows showing unidirectional flow. Legend (Design 01, Design 02) in the upper right clearly distinguishes color variations.
Related Products
-

Mobile Content Performance Analysis – Data-Driven Business Vision and Marketing Strategy
#Business Vision and Strategy #Marketing Plan and Strategy #Graph
-

Vertical Bar PC Mockup Graph – Market and Competitive Analysis
#Market and Competitor Analysis #Graph #Other
-

Camera Shooting App Analysis Graph – Visualization and Insights
#Product/Service Introduction #Market and Competitor Analysis #Graph
-

Presentation Slide Visualizing Company Performance with Column Chart
#Company Introduction #Market and Competitor Analysis #Diagram
