Business Area Diffusion Diagram – Connection and Cluster
RJ0300038_15
- Last Update 04/28/2025
- File Size 0.2MB
- # of Slides 2
- File Format PPTX
- Slide Ratio 16:9
- Color
Keywords
- #Content-Based Slides
- #Design-Based Slides
- #Company Introduction
- #Business Introduction
- #Diagram
- #Business Areas
- #Business Areas
- #Cluster
- #Spread
- #Chain Diagram
- #Centralized Diagram
- #16:9
- #radial diagram PowerPoint
- #diffusion diagram slide template
- #center-connected diagram
- #business map presentation
- #5-node diagram PowerPoint template
About the Product
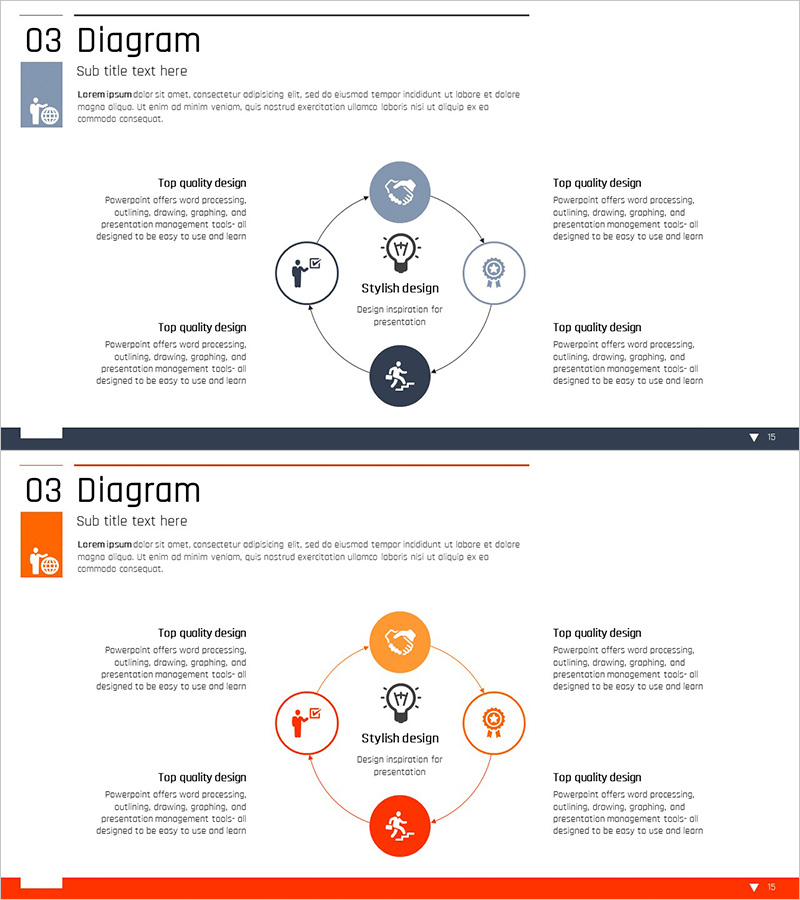
A radial diagram PowerPoint slide with 5 nodes radiating from a central hub in four directions. This design effectively visualizes relationships between core concepts and related elements, making it ideal for business areas, organizational structures, and strategic components. Two color versions (blue and orange) are provided, each with icons and text input areas for easy customization. Available in 16:9 widescreen PPTX format, ready to edit and use in company introductions, business plans, organizational charts, and marketing strategy presentations.
Usage Points
-
Main Usage
Expresses diverse relationships, business areas, and strategies radiating from a central concept. Clearly visualizes center-to-periphery connections such as business divisions, organizational hierarchies, marketing channels, product lines, and strategic elements, enhancing audience comprehension.
-
How to Use
Enter the core topic (e.g., company name, strategy name, product name) in the central node, then fill in detailed items in the four directional nodes. Customize icons to match your industry or content, or simply modify text. Select the color version that best fits your presentation tone.
-
Recommended For
Recommended for business presentations by executives, marketing teams, strategic planning departments, and sales teams. Effective for business plans, marketing proposals, organizational introductions, product portfolios, and strategic planning reports where complex information needs systematic organization.
-
Slide Structure
Composed of 1 central main node (icon + text) with 4 surrounding sub-nodes (each with icon + text area) positioned in cardinal directions. Arrows connect nodes to express radial flow. Two slides provided: blue version and orange version for flexible color selection.
Related Products
-

Cooperative Partner Business Areas Diagram
#Company Introduction #Business Introduction #Diagram
-

Astronomy Business Sector Diffusion Diagram
#Company Introduction #Business Introduction #Diagram
-

Business Area Flower Diagram – Ideal for Company Introductions
#Company Introduction #Business Introduction #Diagram
-

Business Value Diagram – Visualizing Business Sectors
#Company Introduction #Business Introduction #Diagram
