VR Business Vision Diagram for Visualizing Business Objectives
RJ0400050_17
- Last Update 05/31/2025
- File Size 0.2MB
- # of Slides 2
- File Format PPTX
- Slide Ratio 16:9
- Color
Keywords
- #Content-Based Slides
- #Design-Based Slides
- #Business Vision and Strategy
- #Diagram
- #Business Vision
- #Business Goals
- #Cluster
- #Chain Diagram
- #16:9
- #cluster diagram PowerPoint
- #3-node relationship diagram slide
- #business vision visualization PPT
- #how to create connection diagram in PowerPoint
- #diagram PowerPoint slide template
About the Product
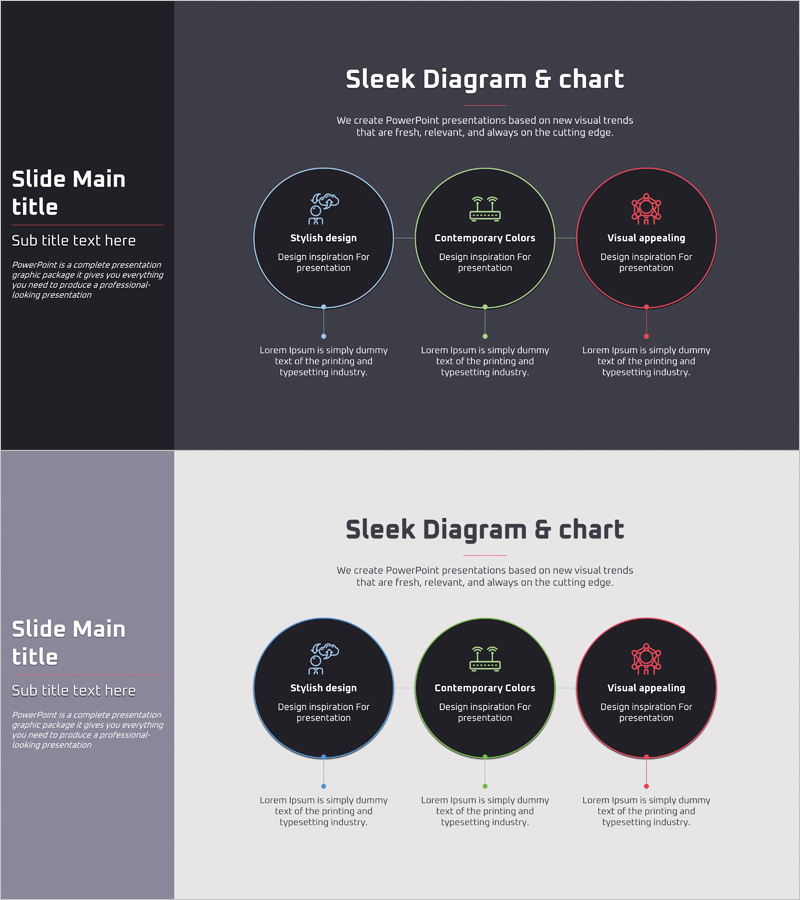
A cluster diagram PowerPoint slide featuring three circular nodes connected by center lines on a dark gray background. Each node is outlined in white with color-coded icons (blue, green, red) representing distinct business elements. Description text areas below each node allow you to detail related concepts such as business vision, strategic objectives, and execution plans. The 16:9 widescreen format across 2 slides is optimized for presenting interconnected business concepts at the beginning of your presentation.
Usage Points
-
Main Usage
Visually represent the relationships and interactions between three key business elements such as vision, strategy, and execution plan. Ideal for executive presentations, business plan pitches, and organizational strategy explanations where abstract concepts need concrete visual representation.
-
How to Use
Replace the icons and text within each circular node with your own content. Modify node colors to match your corporate brand palette or adjust the background tone to fit your presentation style. The text areas below each node can be expanded or condensed based on your content needs.
-
Recommended For
Executives, strategic planning teams, business development professionals, and consultants who need to clearly communicate complex business concepts. Particularly effective when emphasizing the balance and interconnection of three core business elements.
-
Slide Structure
2-slide set. First slide features dark gray background with three circular nodes (blue, green, red borders) connected by center lines. Each node contains an icon, title in center, and description text area below. Second slide provides the same structure with a light background option for versatile presentation contexts.
Related Products
-

Renewable Energy Business Differentiation Strategy Connection Diagram
#Business Vision and Strategy #Diagram #Business Vision
-

Business Vision and Goals Slide – Cluster Diagram
#Business Vision and Strategy #Diagram #Business Vision
-

Triple Connected Learning Diagram – Business Vision and Goals
#Business Vision and Strategy #Diagram #Business Vision
-

Medical Business Goals Connection Diagram
#Business Vision and Strategy #Diagram #Business Vision
