Corporate History Diagram – Capturing Specific Evolution
RM0300010_5
- Last Update 02/09/2025
- File Size 0.3MB
- # of Slides 2
- File Format PPTX
- Slide Ratio 16:9
- Color
Keywords
- #Content-Based Slides
- #Design-Based Slides
- #Company Introduction
- #Product/Service Introduction
- #Diagram
- #History
- #Program Introduction
- #Cluster
- #Chain Diagram
- #16:9
- #timeline diagram PowerPoint
- #corporate history slide template
- #linear connection diagram
- #company evolution presentation
- #milestone visualization PPT
About the Product
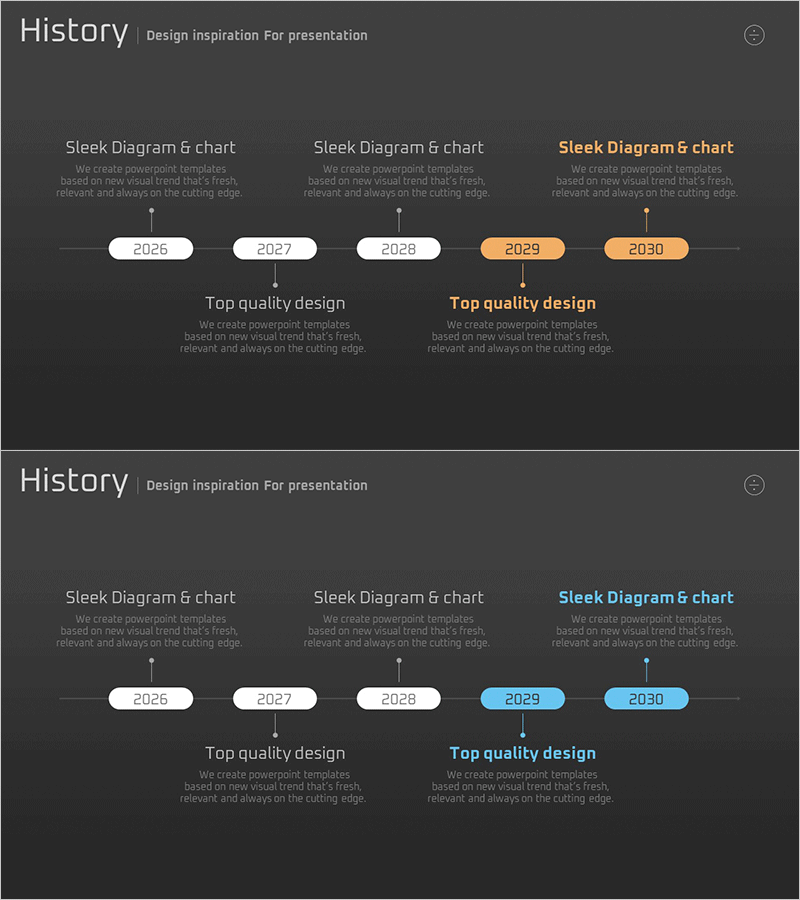
A timeline history diagram PowerPoint slide that visualizes corporate evolution in chronological order. This 2-slide set features a dark background with white and orange dual-tone nodes arranged in a linear connected structure, clearly expressing each year's milestones. Vertical connector lines and label areas enable step-by-step explanation of company history, business expansion, and organizational changes, making it effective for company presentations and corporate profile decks that emphasize organizational credibility. Optimized for all screens in 16:9 widescreen format.
Usage Points
-
Main Usage
Designed to display major organizational milestones from founding to present in chronological sequence, enabling viewers to grasp the company's growth trajectory at a glance. Each node features an independent text area for entering dates, events, and achievements, while vertical connector lines emphasize the flow of time.
-
How to Use
Use in company profile presentations or executive briefing materials to communicate organizational history and credibility. Edit node text to input founding date, first product launch, IPO, global expansion, and other key events. Customize node colors as needed to adjust emphasis by time period and highlight critical transitions.
-
Recommended For
Recommended for corporate executives, investor presentations, new employee orientation, recruitment briefings, and corporate communications professionals. Particularly effective for organizations with long histories or multiple growth phases seeking to emphasize stability and vision.
-
Slide Structure
2-slide composition with the first slide displaying the 5-node timeline diagram and the second slide showing an emphasized version. Each node is designed as an independent input area, with vertical connector lines and arrows indicating time progression direction. Dark background with white base nodes and orange accent nodes to express importance levels.
Related Products
-

Introduction to the Company's History – Vision and Growth
#Company Introduction #Product/Service Introduction #Diagram
-

Corporate History on the Path to Success
#Company Introduction #Product/Service Introduction #Diagram
-

Pictogram History Diagram – Visual Timeline for Company Introduction
#Company Introduction #Product/Service Introduction #Diagram
-

Hexagon Gradient Diagram – A Visually Appealing History Slide
#Company Introduction #Product/Service Introduction #Diagram
