Shopping Mall Payment Diagram – Harmony of Teal and Orange
RJ0400046_28
- Last Update 05/29/2025
- File Size 0.4MB
- # of Slides 2
- File Format PPTX
- Slide Ratio 16:9
- Color
Keywords
About the Product
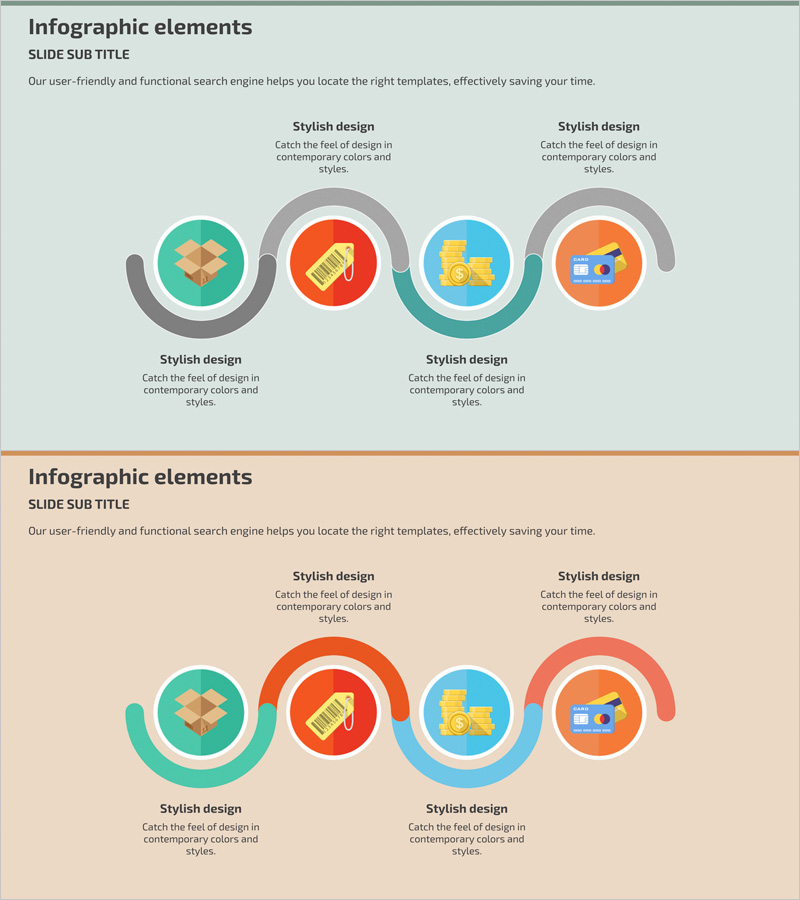
A 4-node connected diagram PowerPoint slide that visualizes shopping mall payment processes and business workflows. Circular icons in teal, red, orange, and blue are linked by gray curved arrows, clearly expressing step-by-step operational flow. The 2-slide set includes one layout with text area at the top and another with text area at the bottom, accommodating various presentation scenarios. Each node features an icon for intuitive representation of payment, shipping, customer management, and other operational stages. Fully editable colors and text enable immediate use in operational planning, process improvement, and system introduction presentations.
Usage Points
-
Main Usage
Visualizes multi-stage business processes in e-commerce, payment systems, and operations using 4 connected nodes. Clearly expresses sequential workflows such as payment, shipping, customer management, and post-service handling to enhance understanding. Effectively communicates process improvements in meetings, reports, and training materials.
-
How to Use
Edit each node's icon and text to match your operational stages. Modify arrow colors to emphasize priority or flow direction. Select the appropriate 2-slide layout for your presentation context, then input title, description, and data fields.
-
Recommended For
Operations teams, planning departments, and system administrators explaining business processes. Ideal for shopping mall, payment system, and logistics management presentations. Suitable for new employee training, process improvement meetings, and executive reports requiring clear visualization of complex workflows.
-
Slide Structure
2-slide set. Each slide features 4 circular nodes (approximately 80px diameter) connected left-to-right by gray curved arrows. First slide includes title and subtitle area at top; second slide has descriptive text area at bottom. Each node consists of a color-coded background with centered icon space for customization.
Related Products
-

IT Intra Business Process Diagram – Intuitive Representation of Technical Efficiency
#Operational Plan #Technical Approach #Diagram
-

Simple System Diagram – Operations Planning and Service Configuration
#Operational Plan #Technical Approach #Diagram
-

Divorce Process Diagram – Business Operation Strategy
#Business Strategy #Operational Plan #Diagram
-

Blue Green Sequence Diagram
#Business Management #Operational Plan #Diagram
