Business Strategy Connected Diagram – Workflow and Technical Execution
RJ0300027_28
- Last Update 04/25/2025
- File Size 0.4MB
- # of Slides 2
- File Format PPTX
- Slide Ratio 16:9
- Color
Keywords
- #Content-Based Slides
- #Design-Based Slides
- #Operational Plan
- #Technical Approach
- #Diagram
- #Business Processes
- #Service Implementation Plan
- #Flow
- #Cluster
- #Chain Diagram
- #16:9
- #connected diagram PowerPoint
- #4-node diagram slide
- #business process PowerPoint
- #radial diagram template
- #diagram PowerPoint slide design
About the Product
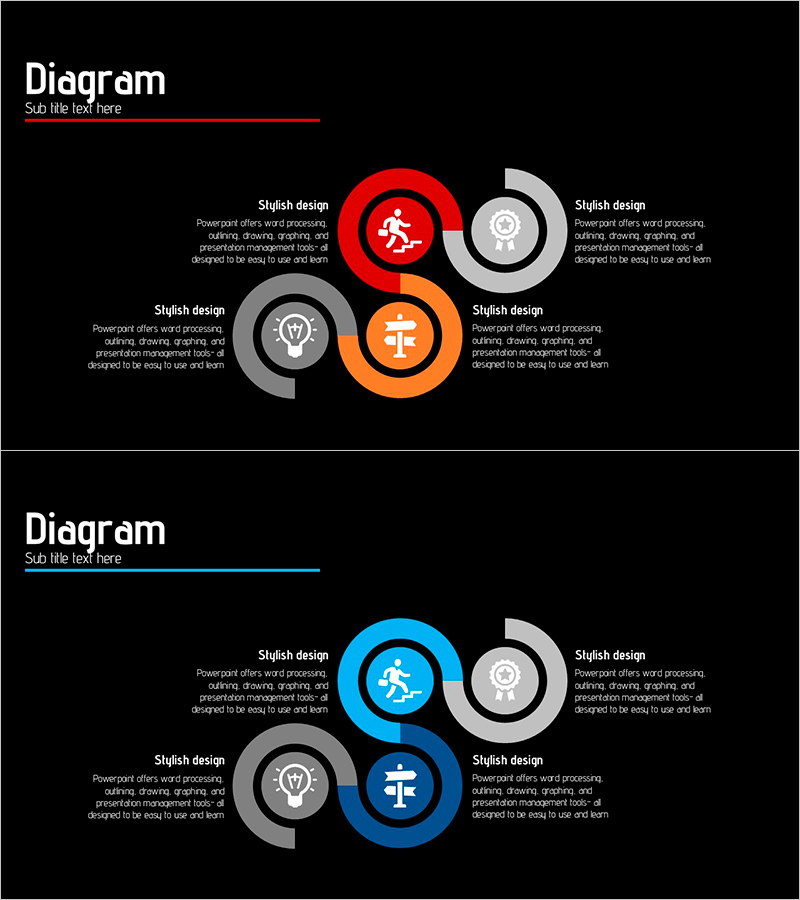
A 4-node connected diagram PowerPoint slide designed to visualize business strategy and workflow processes. Four circular nodes in red, orange, blue, and gray are arranged radially around a central hub, each featuring an icon and text input area. The 2-slide set includes color variations (red and blue emphasis) for flexible presentation contexts. Instantly applicable to technology execution, workflow mapping, strategic planning, and decision-making scenarios in business presentations.
Usage Points
-
Main Usage
Visually represent business strategy development, workflow processes, technology execution plans, and inter-organizational relationships. The central hub structure clearly communicates the relationship between core concepts and surrounding elements.
-
How to Use
Enter strategy items, process steps, department names, or technology elements into each node's text area. Use the 2-slide color variations to match your presentation tone or apply different color versions based on priority levels. Ideal for executive briefings, strategy meetings, and technical presentations.
-
Recommended For
Executives, strategy planners, technology managers, project managers, and organizational development professionals explaining business strategy, technology roadmaps, and workflow processes. Particularly recommended for cross-departmental collaboration, integrated system implementation, and strategic planning presentations.
-
Slide Structure
Four circular nodes (red, orange, blue, gray) arranged radially around a central point. Each node contains an icon area and text input field. 2-slide set: Slide 1 emphasizes red, orange, and gray; Slide 2 emphasizes blue and gray for color variation.
Related Products
-

Sleek Presentation Template Emphasizing Business Context
#Business Strategy #Operational Plan #Technical Approach
-

Introducing SUV Features – Enhancing Ride Quality in Operations Planning
#Operational Plan #Technical Approach #Diagram
-

Circular Strategy Process for Goal Achievement
#Operational Plan #Technical Approach #Diagram
-

Procedures for Applying for a Move-in of a Silver Town – Step-by-Step Flow Description
#Business Strategy #Operational Plan #Diagram
