Market Analysis Segmented Vertical Bar Graph – Target Market Analysis
RJ0400045_7
- Last Update 05/29/2025
- File Size 3MB
- # of Slides 2
- File Format PPTX
- Slide Ratio 16:9
- Color
Keywords
- #Content-Based Slides
- #Design-Based Slides
- #Market and Competitor Analysis
- #Graph
- #Market Analysis
- #Target Market
- #Column
- #Segmented Column
- #16:9
- #segmented vertical bar chart PowerPoint
- #market analysis slide template
- #monthly data comparison chart
- #multi-series bar graph template
- #sales performance analysis PPT
About the Product
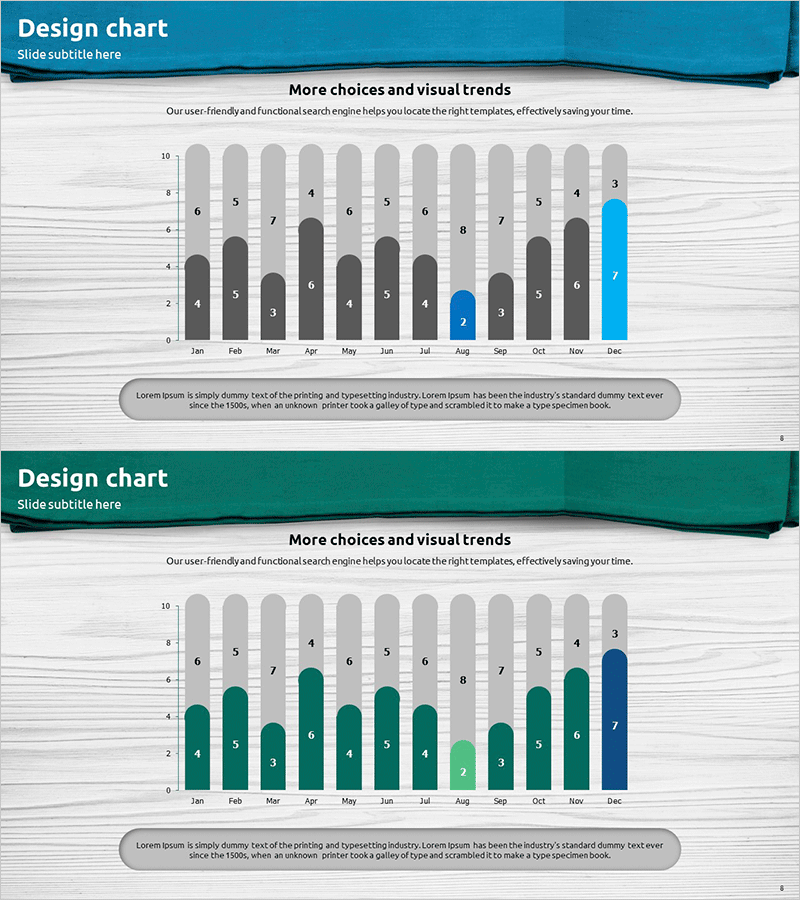
A professional segmented vertical bar chart PowerPoint slide optimized for market analysis and sales performance comparison. This template visualizes 12-month monthly data across four data series (gray, black, green, and blue), with numerical labels displayed above each bar for precise data reading. The wood-textured background combined with a teal header design creates a polished, business-ready presentation. Ideal for target market analysis, competitive benchmarking, and quarterly performance reviews. The 2-slide set allows you to present multiple datasets simultaneously, making it perfect for comprehensive market analysis presentations and investor pitch decks.
Usage Points
-
Main Usage
Compare multiple data sets simultaneously across months, quarters, or years using a segmented vertical bar chart that clearly visualizes quantitative metrics such as market size, sales revenue, and customer counts. The numerical labels above each bar ensure accurate data communication, while the four color-coded series enable quick identification of category-specific trends at a glance.
-
How to Use
Use this chart in market analysis reports to display monthly or quarterly sales performance and competitive landscape data. In investor pitch decks, highlight growth trajectories and market expansion. In marketing strategy documents, present target market demand analysis by segment. The template is fully editable—simply input your data and the bar heights adjust automatically for immediate use.
-
Recommended For
Market analysts, marketing managers, sales directors, financial analysts, and executives preparing data-driven decision-making materials. Particularly suited for quarterly performance reviews, competitive benchmarking analysis, customer segmentation studies, and multi-period trend comparisons in business presentations.
-
Slide Structure
Two-slide template featuring identical segmented vertical bar chart layouts. Each slide displays a 12-month timeline (January–December) on the X-axis with a 0–10 scale on the Y-axis, four data series in distinct colors (gray, black, green, blue), and numerical value labels above each bar. The teal header area accommodates title and subtitle text, while the bottom text box provides space for explanatory notes or data source citations.
Related Products
-

Target Market Year-to-Year Comparison Analysis – Visualizing Market Trends
#Market and Competitor Analysis #Graph #Other
-

Colored Pencil Marking Global Map Slide
#Market and Competitor Analysis #Other #Market Analysis
-

Asian Target Market Analysis Graph
#Market and Competitor Analysis #Graph #Other
-

ABSTRACT PATTERN Presentation COLUMN CHART - Market and Competitor Analysis
#Market and Competitor Analysis #Graph #Market Analysis
