Medical Analysis Table – Suitable for Market and Competitive Analysis
RJ0400045_28
- Last Update 05/29/2025
- File Size 3MB
- # of Slides 2
- File Format PPTX
- Slide Ratio 16:9
- Color
Keywords
About the Product
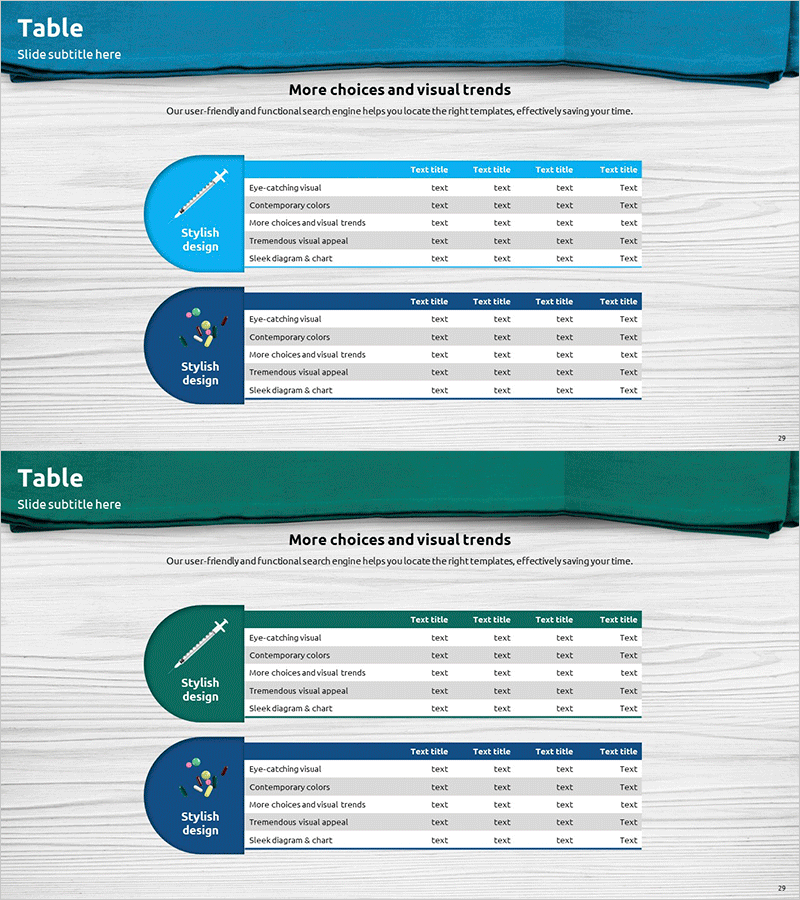
A data table PowerPoint slide optimized for market analysis and competitive comparison. This 2-slide presentation features a high-contrast layout with cyan and navy blue backgrounds paired with white text. Each slide is structured as a 5-row by 4-column table with an icon area on the left side for visual category differentiation. The design is immediately applicable to business presentations, reports, and proposals, providing a professional framework for displaying comparative data and analytical insights.
Usage Points
-
Main Usage
Clearly visualizes quantitative data and comparative information for analytical presentations. Ideal for market overview, competitor benchmarking, SWOT analysis, financial metrics, and other data-driven decision-making materials. The high-contrast color scheme and structured table format enhance audience comprehension and retention.
-
How to Use
Enter analysis categories (market size, market share, pricing, technology capability, etc.) in each row, and place comparison subjects (competitors, time periods, regions, etc.) in each column. Add category icons to the left icon area for visual emphasis. Keep text and numerical values concise to enable at-a-glance comparison and quick decision-making reference.
-
Recommended For
Recommended for strategy planners, marketing teams, finance departments, and executives preparing analytical reports. Suitable for business plans, investor pitch decks, market research reports, executive briefings, and consulting proposals where data-driven insights support strategic decisions.
-
Slide Structure
2-slide set with each slide featuring a title area at the top, a circular icon area on the left, and a 5-row by 4-column data table on the right. The first slide uses cyan background while the second uses navy blue for visual variety. Both slides are optimized for 16:9 widescreen format with consistent spacing and alignment.
Related Products
-

Graph Charts for Systematic Market Analysis – Bar and Pie Charts
#Technical Approach #Market and Competitor Analysis #Diagram
-

Simple & Modern Wide PPT Mockup for Business Insights
#Market and Competitor Analysis #Financial Plans and Performance #Diagram
-

Marketing Performance Analysis Chart by Year – Visualizing Market Trends
#Market and Competitor Analysis #Diagram #Graph
-

Comparative Analysis Bar Graph & Table – Optimized for Market and Competitor Analysis
#Market and Competitor Analysis #Diagram #Graph
