Health Check Presentation Template – Visual Appeal
RJ0400043_14
- Last Update 05/28/2025
- File Size 0.3MB
- # of Slides 2
- File Format PPTX
- Slide Ratio 16:9
- Color
Keywords
About the Product
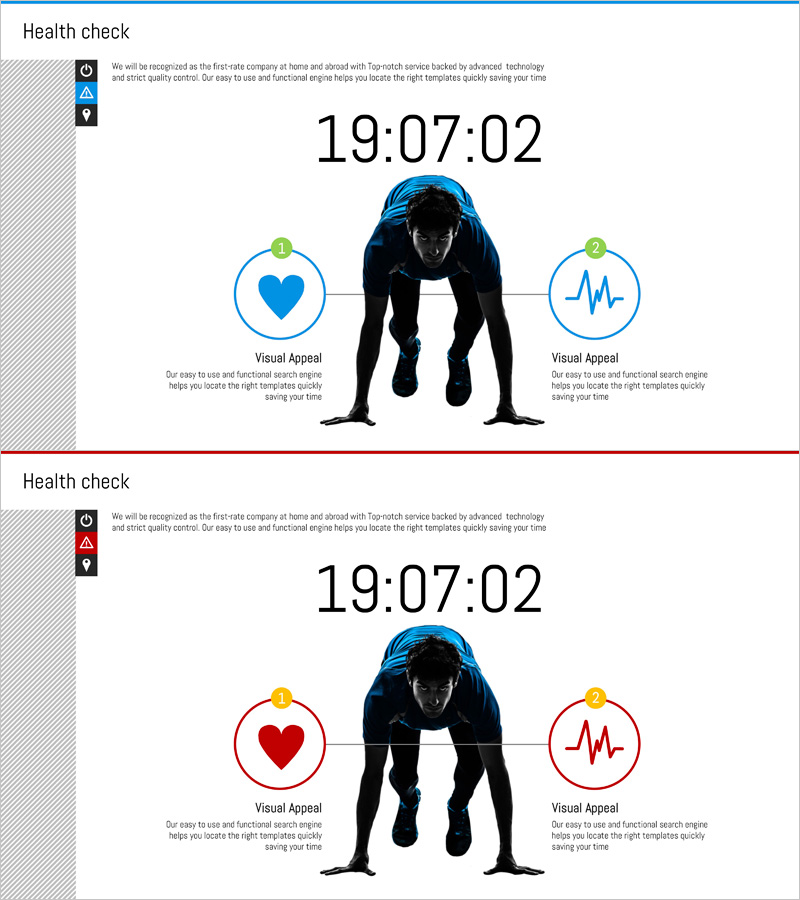
A business health diagnostic PowerPoint slide that visually assesses organizational performance and strategic alignment. The two-column layout contrasts normal status (blue) with alert status (red), using heart icon and pulse graph to communicate key metrics intuitively. Delivered in 16:9 widescreen PPTX format with timestamp overlay for real-time monitoring effect. Immediately applicable to business performance reviews, organizational health assessments, and strategic checkpoint presentations.
Usage Points
-
Main Usage
Diagnose business health quantitatively and qualitatively for executive and board reporting. The dual-state display (blue for normal, red for alert) strengthens comparative analysis, while heart and pulse metaphors intuitively convey organizational vitality and performance metrics.
-
How to Use
Use in business performance reports, strategic review meetings, and organizational health assessment presentations as a diagnostic section. Customize the timestamp to actual presentation time and replace left/right icons and text with company-specific metrics such as revenue, customer satisfaction, or team capability.
-
Recommended For
Recommended for C-suite executives, CFOs, business unit heads, and strategy teams conducting quarterly or annual business performance reviews. Also suitable for organizational diagnostics, risk management, and decision-support materials, as well as consulting and coaching industries for client situation analysis.
-
Slide Structure
Two-slide set. Each slide features a central silhouette with two input areas: left side (heart icon plus text field) and right side (pulse graph plus text field). Top timestamp and left-side icons (info, alert, location) clearly distinguish status conditions.
Related Products
-

Visual Diagram Slide for Cooperative Systems
#Product/Service Introduction #Business Vision and Strategy #Technical Approach
-

Slide Visualizing Business Vision and Strategy with 3 Included Components
#Product/Service Introduction #Business Vision and Strategy #Diagram
-

Business Strategy Inclusion Diagram – Cluster Diffusion Model
#Product/Service Introduction #Business Vision and Strategy #Diagram
-

Breakdown of Tea Components and Benefits – Product Overview and Business Strategy
#Product/Service Introduction #Business Vision and Strategy #Diagram
