Business Strategy Inclusion Diagram – Cluster Diffusion Model
RB0800074_3
- Last Update 03/28/2025
- File Size 0.1MB
- # of Slides 2
- File Format PPTX
- Slide Ratio 4:3
- Color
Keywords
- #Content-Based Slides
- #Design-Based Slides
- #Product/Service Introduction
- #Business Vision and Strategy
- #Diagram
- #Composition
- #Business Strategy
- #Cluster
- #Spread
- #Inclusive Cluster Diagram
- #Decentralized Diagram
- #4:3
- #cluster diagram PowerPoint
- #overlapping diagram slide
- #business strategy presentation
- #3-circle Venn diagram
- #relationship diagram PowerPoint
- #intersection diagram slide template
About the Product
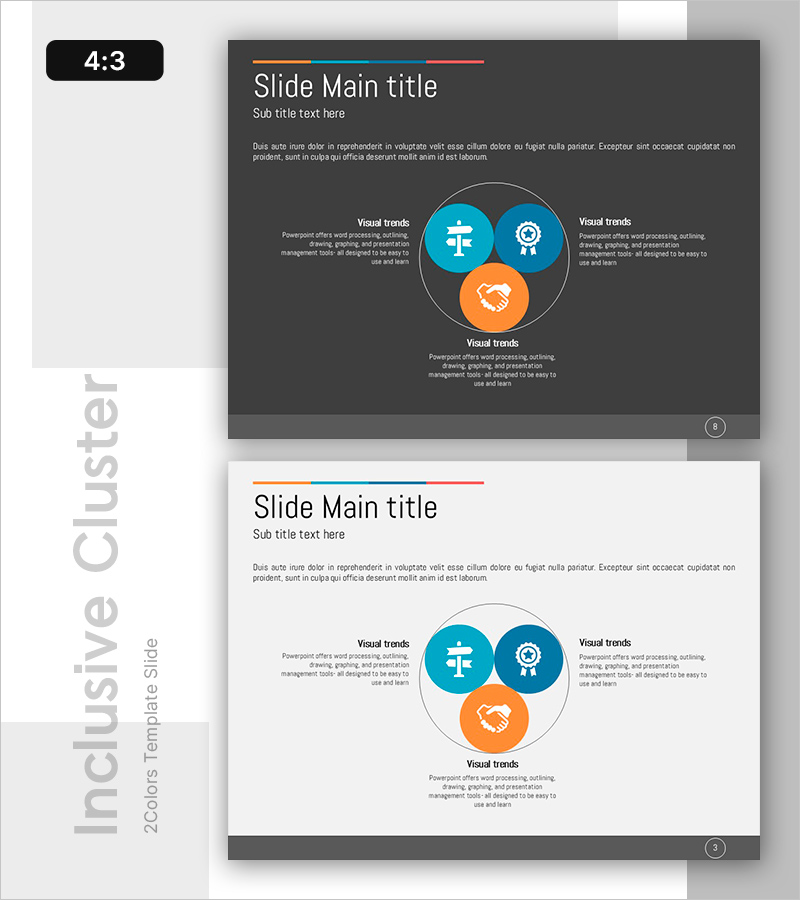
A cluster diagram PowerPoint slide featuring three circular nodes with overlapping intersections to express multi-layered relationships. Set against a dark gray background with blue and orange circular icons, this slide clearly visualizes business strategy, visual trends, and core values at their intersection points. The 2-slide set includes both dark and light theme variations, with each node containing icons and text description areas. Instantly applicable to presentations requiring multi-dimensional relationship mapping such as organizational strategy, cross-departmental collaboration, and product positioning.
Usage Points
-
Main Usage
Visualizes organizational core strategies and cross-departmental intersection points, or expresses multi-layered product positioning. The three-element relationship and intersection points are clearly displayed to intuitively convey complex business concepts.
-
How to Use
Replace the icons and text in each circular node with your organization's core values, market positioning, customer needs, or other key elements. Place your core message in the central intersection area to emphasize strategic focus.
-
Recommended For
Executive reports, strategic planning presentations, organizational restructuring explanations, product launch presentations, marketing positioning materials, and consulting proposals where multi-element relationships need clear explanation.
-
Slide Structure
Three circular nodes (two blue, one orange) overlap to form intersection areas. Each node includes an icon and text label such as 'Visual trends,' with the central intersection area available for additional description input. Two color variations are provided: dark theme (slide 1) and light theme (slide 2).
Related Products
-

Slide Visualizing Business Vision and Strategy with 3 Included Components
#Product/Service Introduction #Business Vision and Strategy #Diagram
-

Two Nested Diagrams – Product Introduction and Composition
#Product/Service Introduction #Diagram #Features
-

Overview of Major Organs and Their Functions – Visualized Infographic
#Product/Service Introduction #Diagram #Other
-

Bulb Shape Configuration Diagram – Business Strategy Visualization
#Product/Service Introduction #Business Vision and Strategy #Diagram
