Clothing Business Strategy Diagram – Effective Visualization of Strategy
RM0100015_6
- Last Update 01/29/2025
- File Size 3.5MB
- # of Slides 2
- File Format PPTX
- Slide Ratio 16:9
- Color
Keywords
- #Content-Based Slides
- #Design-Based Slides
- #Product/Service Introduction
- #Business Vision and Strategy
- #Diagram
- #Composition
- #Business Strategy
- #Table
- #Standard Table
- #16:9
- #table diagram PowerPoint
- #business strategy presentation slide
- #5-item comparison template
- #clothing industry strategy PPT
- #business strategy visualization slide
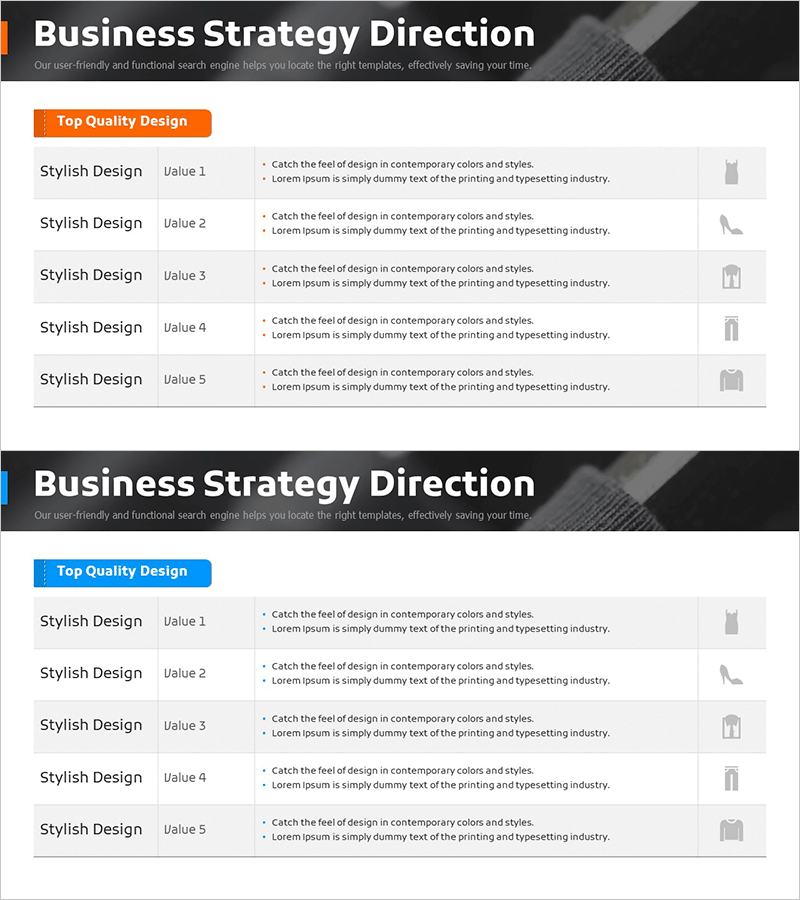
About the Product
A 5-item business strategy table diagram PowerPoint slide designed to visualize clothing industry strategy effectively. Features an orange header and gray icons in a horizontal table layout that clearly organizes each strategic element. This 2-slide, 16:9 ratio PPTX file is ready for immediate editing and works perfectly for business strategy presentations, product introductions, marketing plans, and corporate reports. Ample description space under each item enables clear communication of key business concepts.
Usage Points
-
Main Usage
Designed to systematically explain five core business strategy elements through visual categorization. Applicable to various industries beyond clothing—including marketing plans, product positioning, operational strategies, and competitive analysis presentations.
-
How to Use
Enter strategy element names and descriptions in each item's text area. The orange header emphasizes titles while gray icons represent category types for each item. Colors and icons can be freely customized to match your corporate brand guidelines.
-
Recommended For
Marketing managers, strategy planning teams, business development professionals, and product managers presenting business strategies, investor pitches, and internal reports. Particularly recommended for fashion, retail, and apparel industry professionals.
-
Slide Structure
Two-slide layout with the first slide featuring a 5-item horizontal table diagram and the second slide offering a layout variation. Each item functions as an independent input area, optimized for 16:9 aspect ratio display.
Related Products
-

Table Comparison Slide | Structured Data Layout PPT
#Product/Service Introduction #Business Management #Diagram
-

Sugar Content by Fruit – Revenue Performance Analysis
#Product/Service Introduction #Financial Plans and Performance #Diagram
-

Agricultural and Marine Products Icon Text Table
#Product/Service Introduction #Diagram #Features
-

Data Visualization Diagram for Cosmetic Ingredient List
#Product/Service Introduction #Diagram #Composition
