Triangle Connection Cycle Diagram – Business Strategy and Vision
RJ0400070_12
- Last Update 06/06/2025
- File Size 0.1MB
- # of Slides 2
- File Format PPTX
- Slide Ratio 16:9
- Color
Keywords
- #Content-Based Slides
- #Design-Based Slides
- #Product/Service Introduction
- #Business Vision and Strategy
- #Diagram
- #Composition
- #Business Strategy
- #Cluster
- #Chain Diagram
- #16:9
- #triangle diagram PowerPoint
- #connection diagram slide template
- #3-stage business strategy presentation
- #cluster diagram PowerPoint
- #business presentation template
About the Product
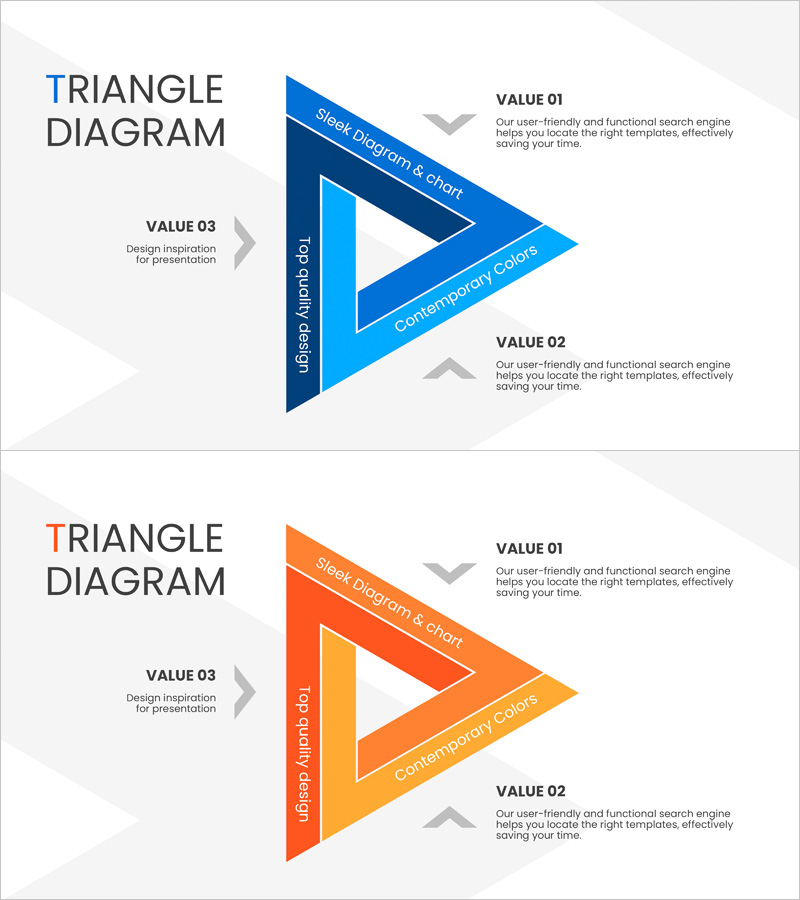
A three-stage triangle connection diagram PowerPoint slide designed for strategic presentations. Available in two color versions—blue and orange—this slide allows you to position strategy elements on each triangle face to represent business strategy, vision, and execution plans in a structured, interconnected format. Optimized for 16:9 widescreen displays with 2-slide composition, it's ready for immediate use in company strategy presentations, business planning sessions, and organizational goal-sharing meetings. Fully editable text and icons enable you to convey your organization's core messages effectively.
Usage Points
-
Main Usage
Visualizes three core strategic elements in a triangle structure to clearly express their interconnected relationships. Ideal for illustrating business strategy, vision, and execution plan—or any three key elements such as product, service, and customer—emphasizing balance and mutual interaction.
-
How to Use
Enter strategy element names in the text areas on each triangle face, then add detailed content in the internal text boxes. Choose between the blue or orange version to match your corporate brand colors. Use in company strategy presentations, executive briefings, team meetings, and strategic planning sessions.
-
Recommended For
Executives, strategic planning teams, business development teams, and marketing professionals explaining organizational strategy, business plans, or product strategy. Particularly effective for management presentations, strategy formulation meetings, and organizational restructuring explanations where three-element balance and integration must be emphasized.
-
Slide Structure
Two-slide composition featuring a blue 3-stage triangle connection diagram on the first slide and an orange version on the second. Each triangle comprises three faces with text input areas and description boxes positioned on each face. Arrows and connector lines express relationships between elements.
Related Products
-

Slide Visualizing Business Vision and Strategy with 3 Included Components
#Product/Service Introduction #Business Vision and Strategy #Diagram
-

Bulb Shape Configuration Diagram – Business Strategy Visualization
#Product/Service Introduction #Business Vision and Strategy #Diagram
-

Breakdown of Tea Components and Benefits – Product Overview and Business Strategy
#Product/Service Introduction #Business Vision and Strategy #Diagram
-

Introducing the Music Business Structure Program – Visualizing Data and Structure
#Product/Service Introduction #Diagram #Features
