Visual Infographic Slide on Tobacco Characteristics
RJ0400037_8
- Last Update 05/27/2025
- File Size 5.4MB
- # of Slides 2
- File Format PPTX
- Slide Ratio 16:9
- Color
Keywords
- #Content-Based Slides
- #Design-Based Slides
- #Product/Service Introduction
- #Diagram
- #Other
- #Features
- #Composition
- #Cluster
- #Chain Diagram
- #Silhouette
- #16:9
- #silhouette infographic PowerPoint
- #hierarchical diagram slide
- #tobacco characteristics presentation
- #5-layer diagram template
- #infographic slide design
About the Product
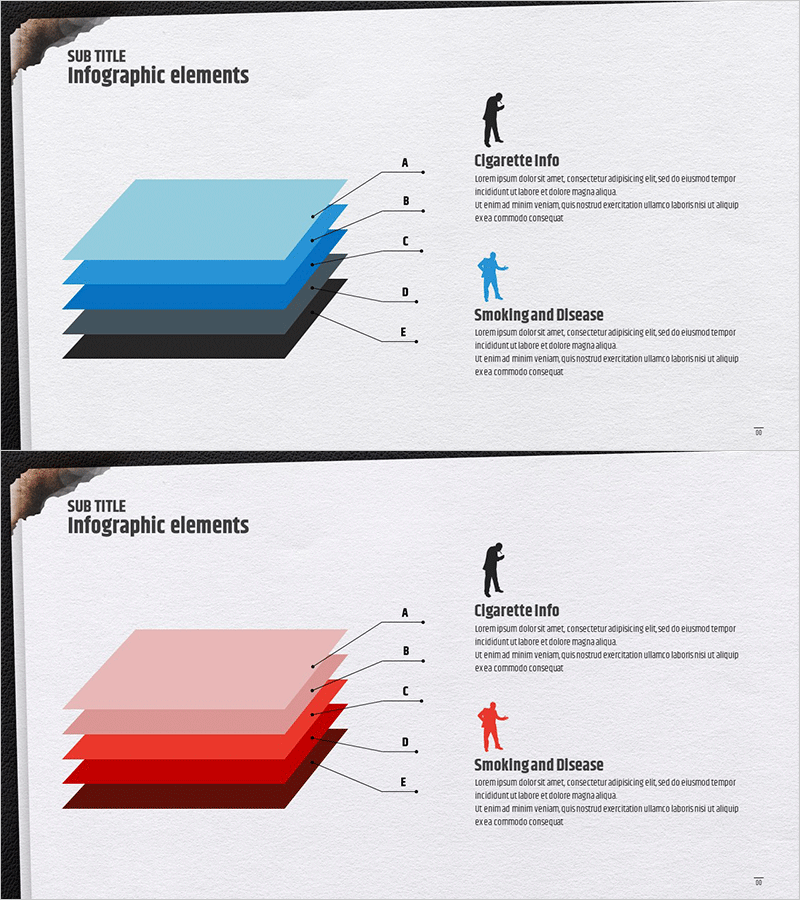
A 2-slide infographic PowerPoint presentation visualizing tobacco characteristics and disease impact through silhouette design. The 5-layer hierarchical diagram features A–E labels for clear information structure, with gradient effects creating depth across layers. Two color versions are provided: blue tone for objective information and red tone for risk emphasis. Human silhouette icons positioned in the Cigarette Info and Smoking and Disease sections convey the topic intuitively. Delivered in 16:9 widescreen PPTX format, fully editable and ready for health, medical, and educational presentations.
Usage Points
-
Main Usage
Designed to classify and visualize tobacco-related information hierarchically. The 5-layer structure combined with human silhouette icons clearly expresses the relationship between tobacco information and smoking-related diseases. Ideal for health education, medical presentations, and policy briefings to communicate complex information in a simple, accessible manner.
-
How to Use
Enter descriptive text for each layer in the A–E label areas. Add primary characteristics to the left hierarchical diagram and specific impact details to the right silhouette sections. Use the blue tone version for objective information delivery and the red tone version to emphasize risk; customize colors as needed for your presentation context.
-
Recommended For
Health professionals, medical experts, educators, policy makers, and smoking cessation campaign coordinators. Suitable for tobacco characteristic analysis, smoking disease education, health policy explanations, medical seminars, and school health education presentations.
-
Slide Structure
Two-slide layout with each slide featuring a left 5-layer hierarchical diagram (A–E labels) and right silhouette icons (Cigarette Info and Smoking and Disease). Gradient effects between layers provide visual depth. Two color versions supplied: blue tone (light blue to dark blue to black) and red tone (light pink to deep red to black).
Related Products
-

Body Structure Description Diagram - Infographic Design
#Product/Service Introduction #Diagram #Other
-

Introducing the Music Business Structure Program – Visualizing Data and Structure
#Product/Service Introduction #Diagram #Features
-

2-Split Triangle Diagram Slide | Symmetrical Comparison PPT
#Product/Service Introduction #Diagram #Features
-

Analysis of Human Response to the Vaccine – Insights into Health
#Product/Service Introduction #Diagram #Features
