Tooth Decay Analysis Table Slide – Market and Competitor Analysis
RJ0400034_14
- Last Update 05/26/2025
- File Size 2.4MB
- # of Slides 2
- File Format PPTX
- Slide Ratio 16:9
- Color
Keywords
About the Product
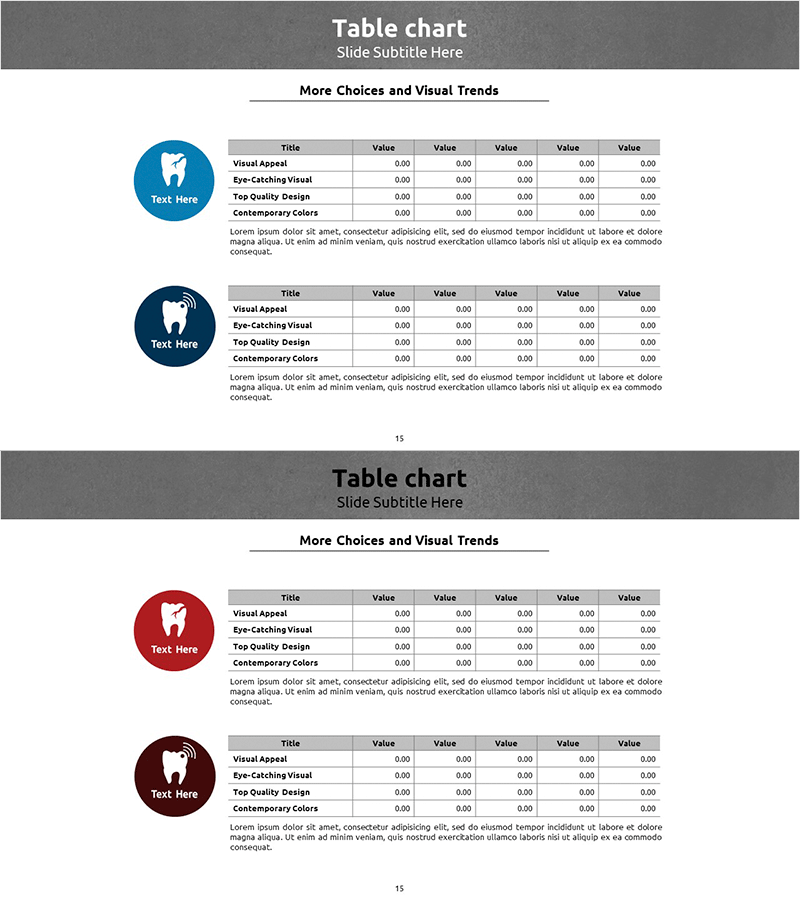
A table chart PowerPoint slide optimized for market analysis and competitor comparison. This 2-slide set features a gray header and white background with a 6-column data layout for structured information display. The left side includes a circular icon area for brand or category identification, while the right side presents numerical data in a clean table format. Each slide includes descriptive text space at the bottom to clearly communicate analysis findings. Ready to use in investor presentations, business reports, marketing plans, and any document requiring data-driven decision-making.
Usage Points
-
Main Usage
Organize quantitative data in table format to compare market conditions, competitors, financial metrics, and other key indicators at a glance. The 6-column structure enables simultaneous evaluation of multiple items and provides clear evidence for strategic decisions.
-
How to Use
Insert brand logos or category names in the left circular icon area, then populate the right table with comparative numerical data. Add analysis insights or conclusions in the bottom text section to support data-driven arguments.
-
Recommended For
Financial analysts, marketing managers, business planners, and investor relations professionals presenting market analysis, competitive benchmarking, financial performance comparisons, and strategic recommendations.
-
Slide Structure
2-slide set with each slide containing a left circular icon area (editable), center title section, right 6-column data table, and bottom descriptive text area. Gray header and white background maximize data readability and professional appearance.
Related Products
-

Depression Self-Assessment Checklist & Mental Health Evaluation Slide
#Market and Competitor Analysis #Diagram #Competitor Analysis
-

Line Chart & Table – Market and Competitor Analysis
#Market and Competitor Analysis #Diagram #Graph
-

Cement Theme Bar Graph & Table
#Market and Competitor Analysis #Diagram #Graph
-

Competitor and Market Analysis Blue Navy PowerPoint Template
#Market and Competitor Analysis #Diagram #Graph
