Childcare Expenses Analysis Graph
RJ0400030_15
- Last Update 05/25/2025
- File Size 8.7MB
- # of Slides 2
- File Format PPTX
- Slide Ratio 16:9
- Color
Keywords
- #Content-Based Slides
- #Design-Based Slides
- #Financial Plans and Performance
- #Graph
- #Projected Return on Investment (ROI)
- #Column
- #Column Chart
- #16:9
- #vertical column chart PowerPoint
- #bar graph slide template
- #cost analysis chart
- #financial data visualization
- #how to create column chart in PowerPoint
About the Product
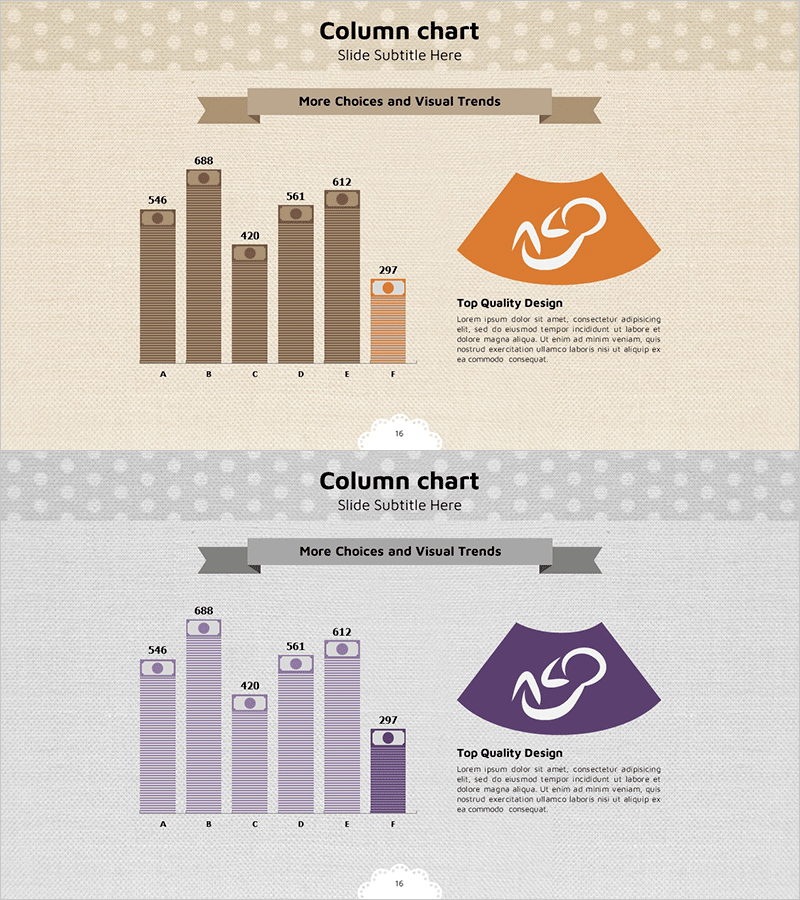
A vertical column chart PowerPoint slide designed for childcare expense analysis and financial data visualization. This presentation template features six data items (A through F) displayed as vertical bars in warm brown tones against a beige background, with an orange accent element on the right side. Each column is labeled with precise numerical values (688, 546, 420, 561, 612, 297) for clear data readability. The slide includes an orange icon and text area for highlighting key insights or conclusions. Ideal for financial planning presentations, budget analysis reports, investment ROI comparisons, and cost breakdown discussions in business meetings.
Usage Points
-
Main Usage
This chart enables intuitive comparison of six numerical values through column height visualization. It effectively displays childcare costs, education expenses, medical fees, and other budget categories at a glance. The numerical labels above each column enhance data accuracy and credibility, making it ideal for budget planning, expense allocation reviews, and cost reduction strategy presentations.
-
How to Use
Slide 1 presents the standard column chart structure where you input six data values for cost comparison analysis. Slide 2 offers the same layout with a purple color variation for visual diversity. Add key insights or conclusions in the right-side icon area to strengthen presentation impact and audience engagement during financial discussions.
-
Recommended For
Finance teams, executives, business planners, investment managers, and educational institution administrators benefit from this template for budget analysis, cost efficiency reviews, and ROI comparison presentations. It's particularly effective for quarterly financial reports, business plans, investor pitch decks, and strategic planning sessions requiring data-driven decision support.
-
Slide Structure
2-slide set. Slide 1: Beige background with six brown vertical columns (A–F), orange accent icon, and text description area. Slide 2: Identical layout with purple column variation. Each column includes numerical labels; 16:9 widescreen format optimized for modern presentation environments and digital displays.
Related Products
-

Curved Theme Purple Template Vertical Bar Chart
#Market and Competitor Analysis #Financial Plans and Performance #Future Outlook
-

Energy Battery Growth Graph Slide
#Financial Plans and Performance #Graph #Projected Return on Investment (ROI)
-

Alphabet Study Bar Chart – Vibrant Design
#Business Strategy #Market and Competitor Analysis #Financial Plans and Performance
-

Color-highlighted Bar Graphs and Tables – Optimized for Financial Analysis
#Financial Plans and Performance #Diagram #Graph
