Business Process Connection Diagram – Effective Workflow Management
RJ0300037_8
- Last Update 04/28/2025
- File Size 1.2MB
- # of Slides 2
- File Format PPTX
- Slide Ratio 16:9
- Color
Keywords
- #Content-Based Slides
- #Design-Based Slides
- #Business Strategy
- #Operational Plan
- #Diagram
- #Step-by-Step Schedule Plan
- #Business Processes
- #Cluster
- #Chain Diagram
- #16:9
- #connection diagram PowerPoint
- #5-step process diagram
- #business process PowerPoint slide
- #workflow visualization slide
- #hexagon diagram PPT template
About the Product
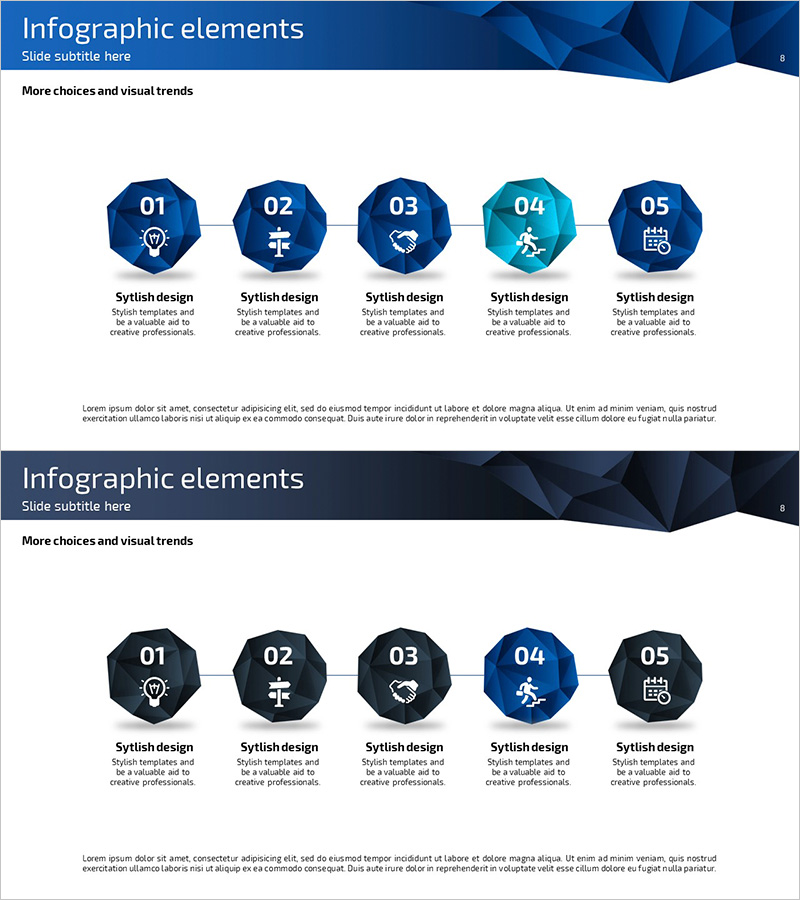
A 5-step connection diagram PowerPoint slide designed to visualize business processes and workflow management. The hexagon nodes are linked by connecting lines, with icons and text labels clearly showing the sequence and relationships between each stage. The color palette transitions from dark blue to light blue, conveying professionalism and trust, while the turquoise accent on the fourth node highlights the critical step. This presentation slide is ready to use for business strategy presentations, operational planning, workflow documentation, and process management reports.
Usage Points
-
Main Usage
Effectively communicate business processes, workflow sequences, project phases, and operational plans by breaking them into five distinct stages, clearly showing the connections and progression between each step.
-
How to Use
Customize each hexagon node by entering stage names, responsible departments, and key activities. Replace icons as needed to match your organization's process. Insert into business plans, operational manuals, process improvement proposals, and strategic presentations.
-
Recommended For
Project managers, operations specialists, strategy planners, and consultants presenting process workflows. Ideal for new employee training, process improvement meetings, executive briefings, and internal communication sessions requiring visual process documentation.
-
Slide Structure
Two-slide layout: the first slide features five hexagon nodes connected by lines in a horizontal arrangement with blue gradient coloring; the second slide presents the same structure on a dark background in dark tones, providing flexibility for different presentation environments.
Related Products
-

4STEP Connection Diagram – Business Strategy Presentation
#Business Strategy #Operational Plan #Diagram
-

Business Connection 3D Diagram – Business Strategy
#Business Strategy #Operational Plan #Diagram
-

Game Business Process Diagram - Visualization of Business Strategy
#Business Strategy #Operational Plan #Diagram
-

Business Process Steps – Efficient Operational Strategy
#Business Strategy #Operational Plan #Diagram
