Business Relationship Diagram for Organizational Visualization – Effective System Structuring
RJ0400069_20
- Last Update 06/06/2025
- File Size 0.7MB
- # of Slides 2
- File Format PPTX
- Slide Ratio 16:9
- Color
Keywords
- #Content-Based Slides
- #Design-Based Slides
- #Company Introduction
- #Technical Approach
- #Diagram
- #Organizational Chart
- #System Architecture Diagram
- #Structure
- #Cluster
- #Tree Diagram
- #Chain Diagram
- #16:9
- #connection diagram PowerPoint
- #organizational chart slide template
- #business relationship diagram PPT
- #system structure diagram
- #how to create organizational chart in PowerPoint
About the Product
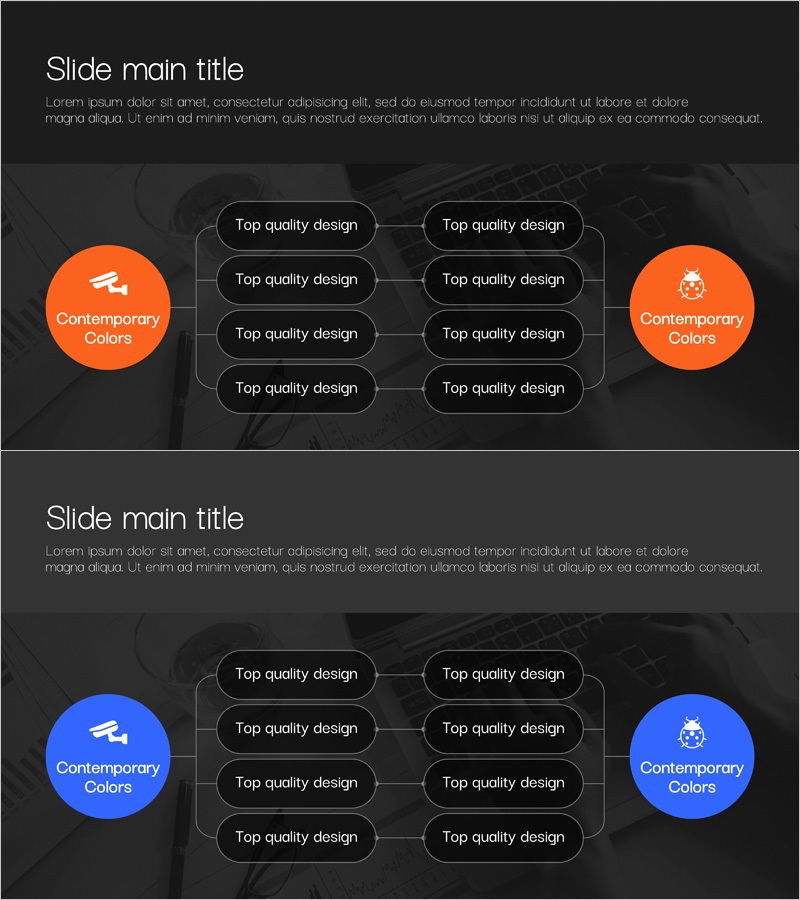
A connection diagram PowerPoint slide designed to visualize business relationships and organizational structures. Features two circular nodes (orange and blue) positioned symmetrically with eight rectangular boxes arranged on both sides to clearly represent inter-organizational relationships and information flow. The dark background with white-bordered boxes and connecting lines emphasizes hierarchical structure across 2 slides in 16:9 widescreen format. Ideal for company organizational charts, system architecture presentations, departmental collaboration frameworks, and cross-functional team structures in professional business presentations.
Usage Points
-
Main Usage
Effectively visualizes inter-organizational relationships, system connectivity structures, and departmental collaboration frameworks. Central nodes represent core organizations or systems while surrounding boxes display related departments or components, creating clear hierarchical relationships.
-
How to Use
Input organization or system names in the circular nodes and detailed items in rectangular boxes. Differentiate organizations using color coding (orange and blue) for visual distinction, and use connecting lines to indicate information flow direction and relationship strength.
-
Recommended For
Executive presentations on organizational structure, IT teams explaining system architecture, consulting firms presenting organizational diagnostics, large-scale project stakeholder mapping, cross-functional team collaboration frameworks, and corporate restructuring communications.
-
Slide Structure
Two-slide layout with the first slide featuring orange bilateral nodes and the second featuring blue bilateral nodes. Each slide contains 8 connected boxes arranged in 2 columns and 4 rows at the center, with connecting lines linking nodes to boxes to represent relationships and data flow.
Related Products
-

Organizational Chart Network Mind Map Slide
#Company Introduction #Technical Approach #Diagram
-

Magic Trick Configuration Diagram – Creative Business Solution
#Business Introduction #Technical Approach #Diagram
-

Structured Map of Learning Topics – Organized for the Technical Sector
#Company Introduction #Technical Approach #Diagram
-

Subway Route Map Shape Diagram – Organizational Structure and Visualization
#Company Introduction #Diagram #Organizational Chart
