Experimental Analysis Bundle Vertical Bar Graph
RJ0400025_15
- Last Update 05/24/2025
- File Size 3.1MB
- # of Slides 2
- File Format PPTX
- Slide Ratio 16:9
- Color
Keywords
About the Product
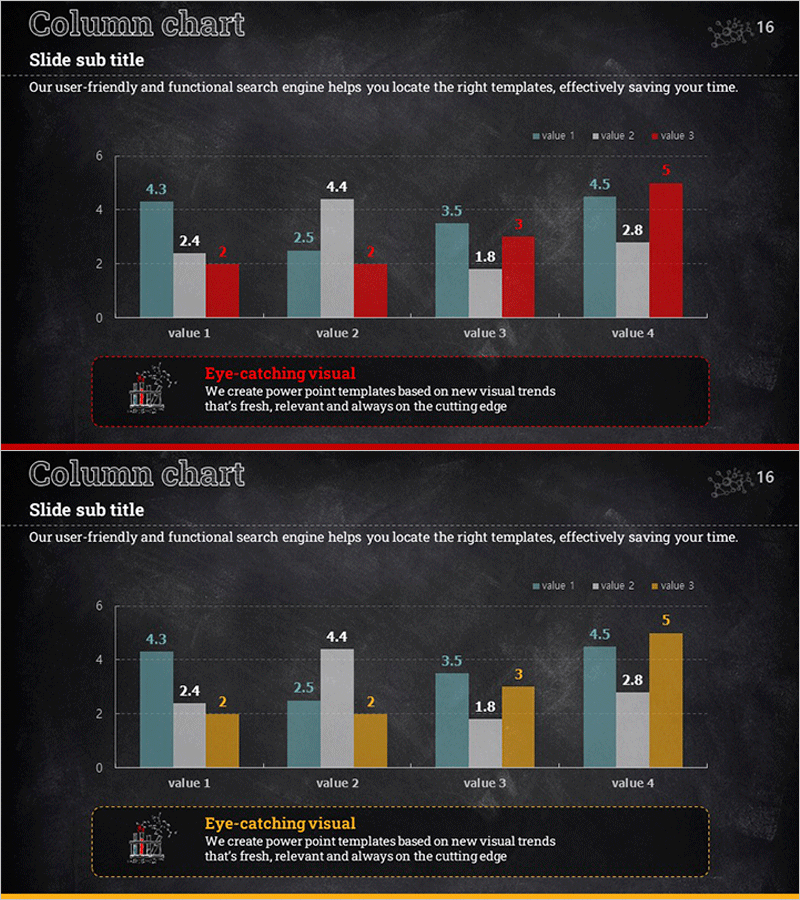
A professional grouped vertical bar chart PowerPoint slide designed for experimental analysis and market research data visualization. This template features three data series in teal, gray, and red colors, enabling side-by-side comparison of four items with precise numerical labels (4.3, 2.4, 2, etc.) displayed above each bar. The dark background provides strong contrast for clear data readability during presentations. The 2-slide set is fully editable, allowing you to customize data values, category labels, and legend information to match your specific analysis requirements.
Usage Points
-
Main Usage
Ideal for presenting multi-series quantitative data where direct comparison across categories is essential. The grouped layout allows viewers to quickly assess differences between series within each category and identify trends across all items simultaneously.
-
How to Use
Insert this slide into your presentation, report, or analysis document where data visualization is needed. Replace the sample data, category names, and series labels with your own information. Use during presentations to explain comparative metrics, performance trends, and analytical findings to stakeholders.
-
Recommended For
Marketing, sales, research, and business analysis teams presenting experimental results, quarterly performance comparisons, competitive analysis, customer satisfaction surveys, and market research findings. Suitable for any business presentation requiring multi-series numerical data visualization.
-
Slide Structure
Two-slide set featuring a title area, subtitle, descriptive text space, and a grouped vertical bar chart with three data series displayed in teal, gray, and red. Four categories are shown on the x-axis with corresponding grouped bars, and precise numerical values are labeled above each bar for clarity.
Related Products
-

Comparative Analysis Vertical Bar Chart – Market and Competitor Analysis
#Market and Competitor Analysis #Graph #Competitor Analysis
-

Marketing Performance Analysis Chart by Year – Visualizing Market Trends
#Market and Competitor Analysis #Diagram #Graph
-

PC Mockup & Column Bundle Graph
#Market and Competitor Analysis #Graph #Other
-

Visual Data Overview of Research Findings – Beginning of Innovation
#Market and Competitor Analysis #Graph #Market Analysis
