Customer Analysis Segmentation Vertical Bar Graph – Market Insights and Business Strategy
RJ0400018_21
- Last Update 05/22/2025
- File Size 0.4MB
- # of Slides 2
- File Format PPTX
- Slide Ratio 16:9
- Color
Keywords
- #Content-Based Slides
- #Design-Based Slides
- #Market and Competitor Analysis
- #Graph
- #Customer Analysis
- #Column
- #Segmented Column
- #16:9
- #segmented vertical bar chart PowerPoint
- #customer analysis slide template
- #4-series bar graph
- #market analysis chart
- #business strategy data visualization
- #PowerPoint slide download
About the Product
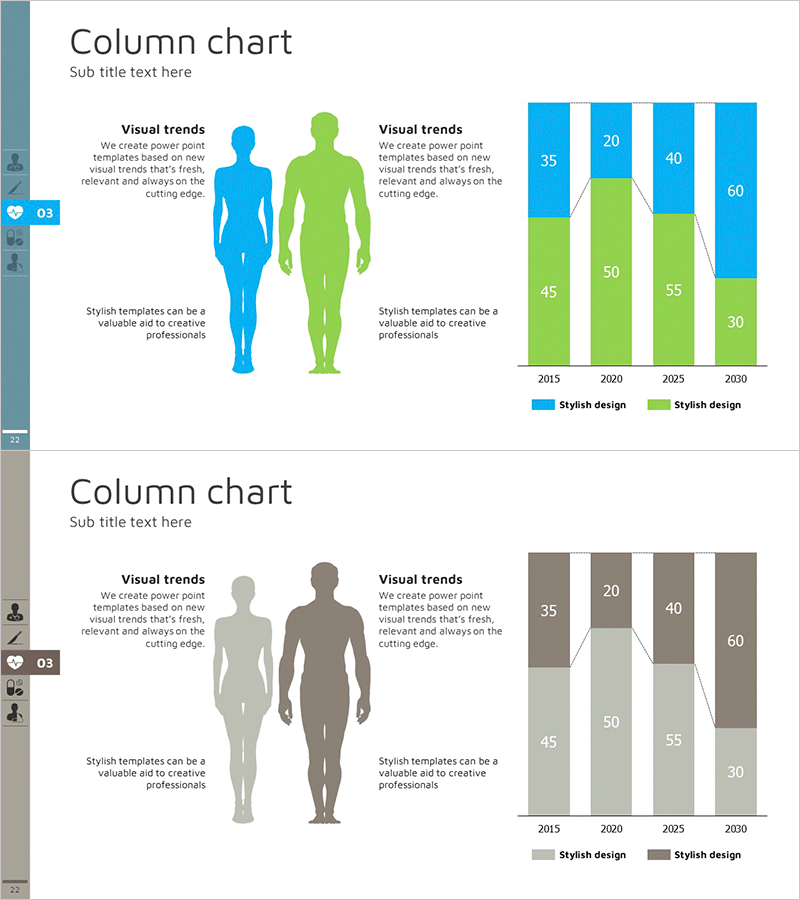
A segmented vertical bar chart PowerPoint slide designed for customer analysis and market insights. This 2-slide template visualizes data across 4 years (2015, 2020, 2025, 2030) with 2 data series (blue and green) comparing customer segments. Human silhouettes accompany demographic information, while numerical labels on each bar enable precise data communication. Ideal for business strategy presentations, market analysis reports, and executive briefings where customer segmentation and trend analysis are critical. Ready-to-use PPT template for immediate deployment in presentations and reports.
Usage Points
-
Main Usage
Visually represent customer segmentation analysis and market trends over time. The slide enables year-over-year and series-by-series data comparison to communicate business performance changes and evolving customer characteristics. Supports data-driven decision-making in marketing strategy, sales planning, and executive reporting.
-
How to Use
Slide 1 features human silhouettes with text descriptions of customer segments. Slide 2 displays the vertical bar chart with numerical data. Edit the bar values with your own data, adjust series colors and legend labels to match your presentation context, and customize text fields as needed.
-
Recommended For
Marketing managers, sales directors, executives, management consultants, and data analysts presenting customer analysis results. Suitable for market segmentation reports, customer profiling, sales trend analysis, business performance reviews, and strategic planning presentations.
-
Slide Structure
Slide 1: Title, subtitle, 2 human silhouettes (blue and green), 2 text description areas. Slide 2: Title, subtitle, vertical bar chart (4 bars, 2 series, numerical labels), legend. 16:9 widescreen format, PPTX file.
Related Products
-

Medical Services Characteristics Connection Diagram
#Market and Competitor Analysis #Graph #Customer Analysis
-

Camping Business Trend Graph – Future and Vision
#Market and Competitor Analysis #Graph #Customer Analysis
-

Section Performance Analysis Bar Chart – Competitor Analysis and Market Strategy
#Business Vision and Strategy #Market and Competitor Analysis #Graph
-

Internet Theme Segmentation Bar Graph – Market Status Analysis
#Market and Competitor Analysis #Graph #Market Status
