Medical Business Goals Circular Diagram – Insights on Design and Strategy
RJ0400018_17
- Last Update 05/22/2025
- File Size 0.7MB
- # of Slides 2
- File Format PPTX
- Slide Ratio 16:9
- Color
Keywords
About the Product
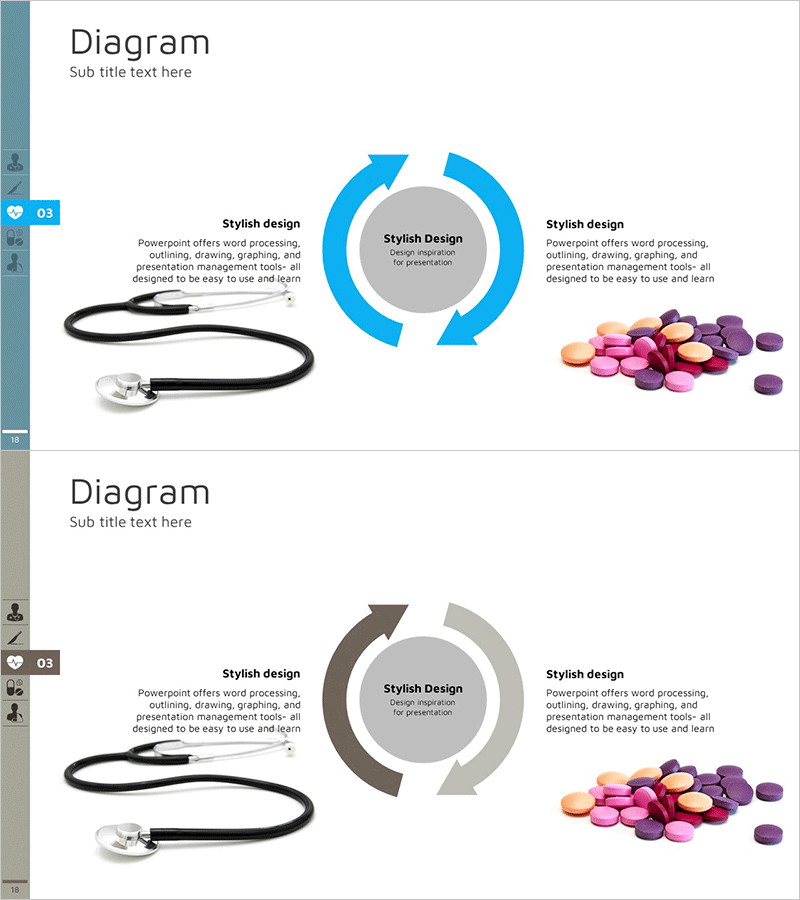
A 2-slide circular diagram PowerPoint presentation designed to visualize medical business goals and strategic initiatives. The bright blue bidirectional arrows create a continuous cycle structure that effectively represents two-way processes, continuous improvement cycles, and feedback loops. The central circular node combined with left and right text areas emphasizes key strategies, making it ideal for explaining medical institution vision, objectives, and execution plans step by step. Created in 16:9 widescreen format optimized for modern presentation environments, with fully editable colors, text, and image placeholders for customization.
Usage Points
-
Main Usage
Visualize medical institution business objectives, vision, and strategy through circular flow to emphasize continuous improvement and feedback mechanisms. Bidirectional arrows intuitively convey interaction, collaboration, and cyclical processes, while the central node focuses audience attention on core messages.
-
How to Use
Use in medical institution executive presentations, business strategy briefings, organizational improvement project kickoffs, and healthcare service innovation plan presentations. Insert specific goals, execution strategies, and performance metrics in left and right text areas, and place core topics in the central circle to enhance audience comprehension.
-
Recommended For
Medical institution executives, healthcare policy officers, hospital strategic planning teams, medical consultants, and healthcare educators. Particularly effective when explaining business goal setting, organizational culture improvement, process innovation, and healthcare service quality enhancement.
-
Slide Structure
2-slide set. Each slide features a central circular node (gray background) with two bright blue arrows forming bidirectional circular flow on left and right sides. Text box areas on both sides allow parallel explanation of two items, with image and icon insertion space at the bottom for visual enhancement.
Related Products
-

Business Marketing Goals – Actionable Strategy Presentation
#Business Vision and Strategy #Marketing Plan and Strategy #Diagram
-

Visualizing Strategy with Promotional Square Diagram
#Business Vision and Strategy #Marketing Plan and Strategy #Diagram
-

Square Box Connection Diagram – Visualizing Business Vision
#Business Vision and Strategy #Business Management #Diagram
-

Plotting Paper Presentation Template Diagram – Business Strategy and Benefits
#Product/Service Introduction #Business Vision and Strategy #Diagram
