Linear Diagram Slide for Marketing and Promotion Plan
RJ0400017_27
- Last Update 05/22/2025
- File Size 0.2MB
- # of Slides 2
- File Format PPTX
- Slide Ratio 16:9
- Color
Keywords
- #Content-Based Slides
- #Design-Based Slides
- #Business Strategy
- #Business Management
- #Diagram
- #Implementation Plan
- #Flow
- #Table
- #Linear Flow
- #16:9
- #linear diagram PowerPoint
- #4-step process slide
- #marketing plan presentation
- #promotion strategy diagram
- #business workflow PPT
- #step-by-step process slide
About the Product
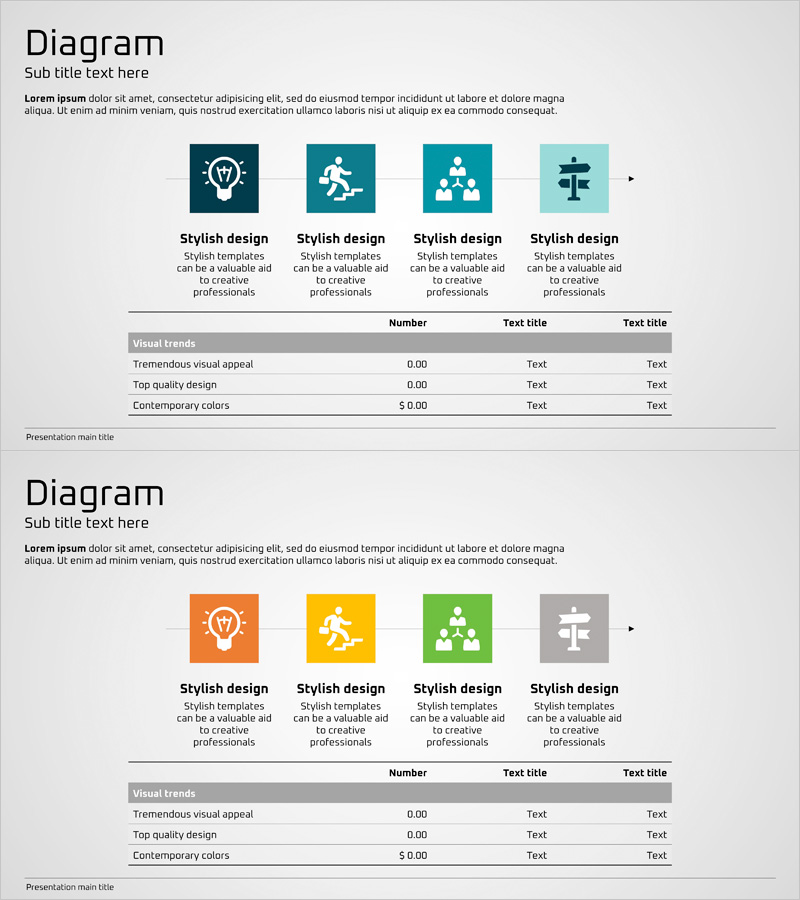
A 4-step linear diagram PowerPoint slide designed to visualize marketing and promotion planning processes. The left-to-right arrow flow clearly represents sequential stages, with four distinct colored icons (dark teal, orange, green, gray) symbolizing each phase. Text areas below each icon allow detailed descriptions to be added. The bottom table section organizes key metrics and numerical data, making it ideal for business strategy presentations, project management, and marketing planning documents. The 2-slide set includes a color-variant layout for flexible design options.
Usage Points
-
Main Usage
Ideal for expressing sequential processes such as marketing strategies, business promotion plans, and project roadmaps in chronological order. Clearly distinguishes each phase's objectives, activities, and responsibilities to enhance organizational understanding and alignment.
-
How to Use
Enter stage names, objectives, and timelines in the text boxes below each icon. Add quantitative metrics such as KPIs, budgets, and responsible departments in the bottom table to strengthen execution plan specificity. Adjust colors to match brand identity.
-
Recommended For
Perfect for marketing professionals, planners, and project managers presenting strategy development and execution plans. Suitable for executive briefings, team meetings, and client proposal presentations where credible data visualization is essential.
-
Slide Structure
2-slide set with each slide featuring 4 nodes (icons) connected by left-to-right arrows in linear flow. Layout includes title and subtitle area at top, 4-step diagram in center, and 3-row data table (Visual trends, metrics, descriptions) at bottom.
Related Products
-

Step by Step Diagram of Playing a Musical Instrument - Fundamentals of Music
#Business Strategy #Business Management #Diagram
-

Business Roadmap Visualized Slide – Business Strategy
#Business Strategy #Business Management #Diagram
-

Annual Schedule Plan Slide – Clear Roadmap for Business Execution
#Business Strategy #Business Management #Diagram
-

Visualizing Business Strategy with Milestone Plan Schedule
#Business Strategy #Business Management #Diagram
