Geometric Shape Diagram – Visualizing Business Areas
RJ0400016_11
- Last Update 05/21/2025
- File Size 0.3MB
- # of Slides 2
- File Format PPTX
- Slide Ratio 16:9
- Color
Keywords
- #Content-Based Slides
- #Design-Based Slides
- #Company Introduction
- #Business Introduction
- #Diagram
- #Business Areas
- #Business Areas
- #Cluster
- #Chain Diagram
- #16:9
- #4-node cluster diagram PowerPoint
- #relationship diagram slide
- #business area visualization
- #connected structure PPT
- #how to create cluster diagram in PowerPoint
About the Product
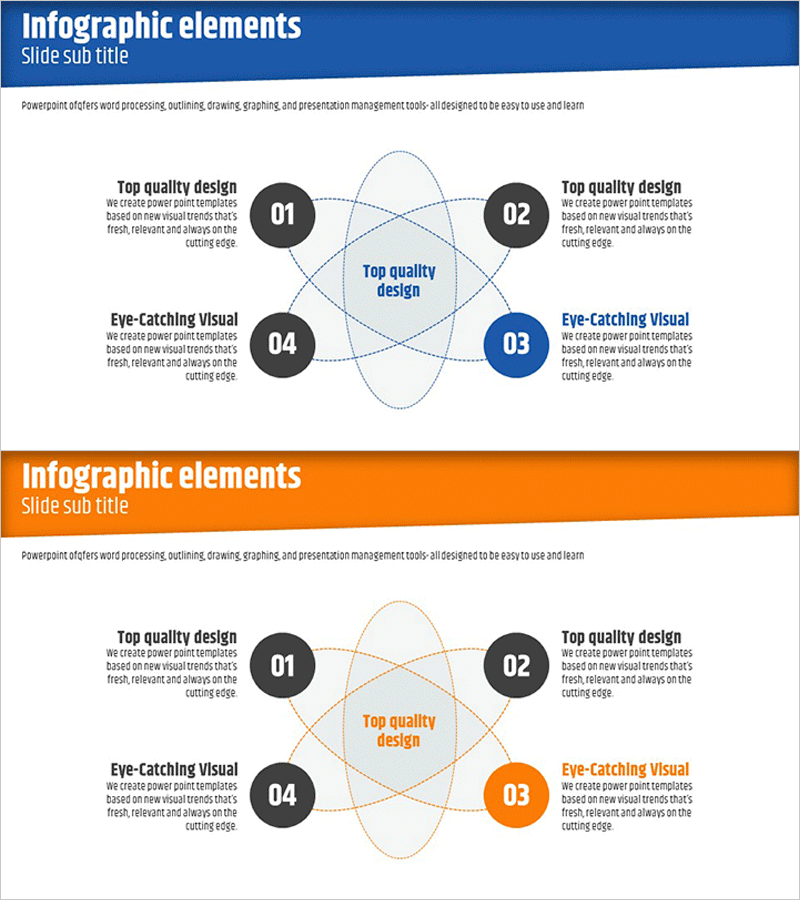
A cluster-style diagram PowerPoint slide connecting four nodes to a central concept. The dual-tone color scheme of blue and orange visually distinguishes emphasis elements, while dotted curved lines express relationships between nodes. This structure effectively conveys complex relationships in business areas, organizational structures, strategic elements, and core values. The 2-slide set offers multiple color combinations, with fully editable text and node sizes. Perfect for presentations, business plans, and strategic documents that require clear visualization of interconnected concepts.
Usage Points
-
Main Usage
Optimized for visualizing relationships between a central concept and surrounding elements. Simultaneously displays four key items such as business areas, organizational structure, strategic elements, and core values, enabling audiences to understand complex relationships at a glance.
-
How to Use
Enter the core concept in the central circle and place detailed items in the four nodes. Use dotted curved lines to emphasize connections, with blue tones for primary items and orange tones for emphasis elements. Applicable to business overview sections in company profiles, core element analysis in strategic plans, and as an alternative to traditional organizational charts.
-
Recommended For
Recommended for executives and planners developing business strategies, HR professionals explaining organizational structures, marketing teams communicating product and service core values, and business development professionals introducing company areas. Ideal for investor presentations, strategy meetings, and organizational restructuring announcements.
-
Slide Structure
2-slide set featuring blue-tone (top) and orange-tone (bottom) versions. Each slide contains one central circle and four nodes arranged in quadrants (top-left, top-right, bottom-left, bottom-right), connected by dotted curved lines. Each node includes numbered areas and text input fields for full customization.
Related Products
-

Business Area Overlay Diagram – A Blend of Visual Appeal and Functionality
#Company Introduction #Business Introduction #Diagram
-

Pentagonal Star Diagram – Cluster for Business Introduction
#Company Introduction #Business Introduction #Diagram
-

Fountain Pen Business Area Diagram – Visualized Cluster Structure
#Company Introduction #Business Introduction #Diagram
-

Business Area Flower Diagram – Ideal for Company Introductions
#Company Introduction #Business Introduction #Diagram
