Fountain Pen Business Area Diagram – Overview for Business Presentation
RJ0300047_11
- Last Update 05/01/2025
- File Size 3.5MB
- # of Slides 2
- File Format PPTX
- Slide Ratio 16:9
- Color
Keywords
- #Content-Based Slides
- #Design-Based Slides
- #Company Introduction
- #Business Introduction
- #Diagram
- #Business Areas
- #Business Areas
- #Cluster
- #Spread
- #Chain Diagram
- #Centralized Diagram
- #16:9
- #radial cluster diagram PowerPoint
- #4-node business area diagram
- #central hub diagram slide
- #business structure presentation template
- #how to create business overview in PowerPoint
About the Product
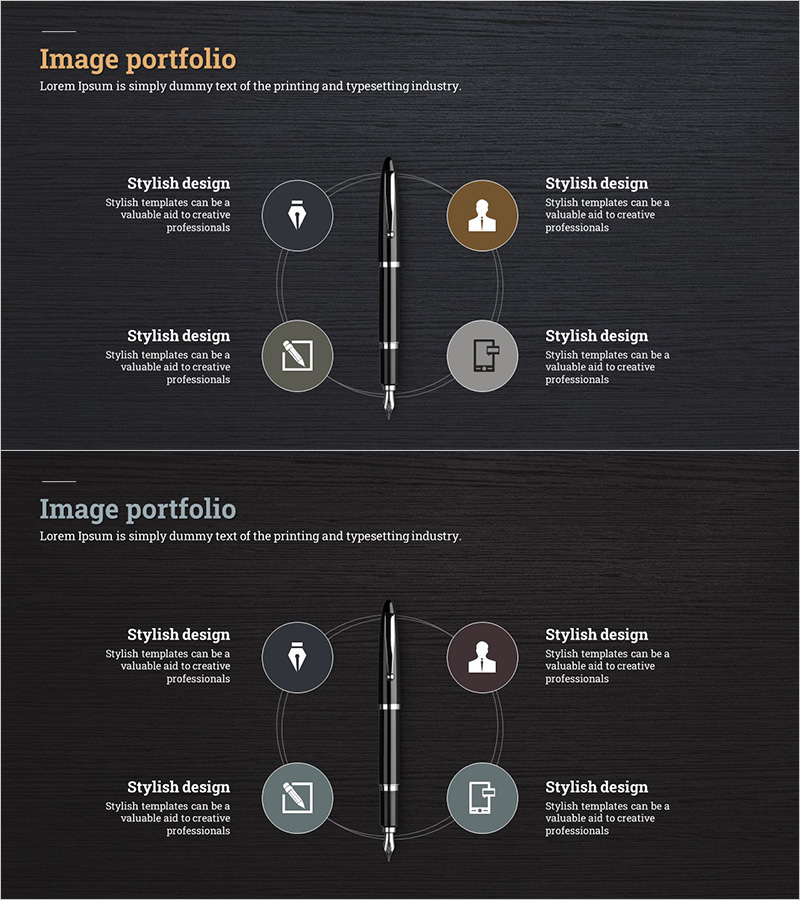
A radial cluster diagram PowerPoint slide with a central focal point connected to four surrounding nodes, ideal for business structure visualization. The design features a dark background with gold title text, circular nodes in gray and bronze tones, a central pen image, and curved connector lines. Each node includes an icon placeholder and text area for describing business areas, product categories, customer segments, or strategic initiatives. This 2-slide set is ready to use in professional business presentations and corporate reports.
Usage Points
-
Main Usage
Visualizes how multiple business elements (products, customers, markets, strategies) connect to and support a central business concept or core offering. Enables clear communication of organizational structure, business relationships, and strategic alignment in executive presentations and business planning sessions.
-
How to Use
Replace the central pen image with your company logo or key product image. Update the four node labels and descriptions to reflect your business areas, product lines, target markets, or competitive advantages. Maintain the dark background aesthetic while customizing node colors to match your brand palette.
-
Recommended For
Business plans, company overview presentations, product launch decks, investor pitch materials, executive briefings, marketing strategy presentations, organizational structure explanations, new business development proposals, and strategic planning documents.
-
Slide Structure
2-slide set. Each slide features a central focal point (pen image) with four circular nodes positioned at top, top-right, bottom-right, and bottom-left. Curved connector lines link each node to the center. Each node contains an icon area and text input field (title + description) for customization.
Related Products
-

Atomic Structure Science Diagram – Visualizing the Essence of Science
#Company Introduction #Business Introduction #Diagram
-

Business Area Flower Diagram – Ideal for Company Introductions
#Company Introduction #Business Introduction #Diagram
-

Astronomy Business Sector Diffusion Diagram
#Company Introduction #Business Introduction #Diagram
-

Real Estate Business Area Diagram – Business Introduction and Cluster
#Company Introduction #Business Introduction #Diagram
