Fountain Pen Business Area Diagram – Visualized Cluster Structure
RJ0300047_8
- Last Update 05/01/2025
- File Size 3.5MB
- # of Slides 2
- File Format PPTX
- Slide Ratio 16:9
- Color
Keywords
- #Content-Based Slides
- #Design-Based Slides
- #Company Introduction
- #Business Introduction
- #Diagram
- #Business Areas
- #Business Areas
- #Cluster
- #Spread
- #Chain Diagram
- #Radial Diagram
- #16:9
- #radial diagram PowerPoint
- #cluster diagram slide
- #central expansion structure
- #4-node diagram
- #business area diagram
- #organizational structure PowerPoint slide
About the Product
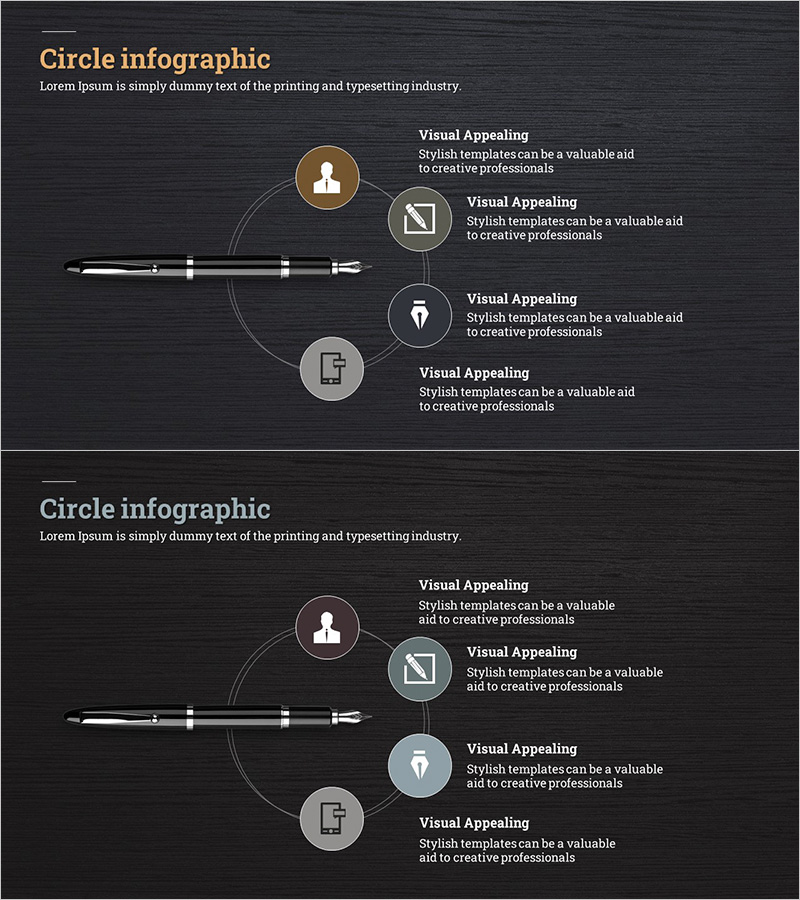
A radial cluster diagram PowerPoint slide with four items radiating from a central point. Designed on a dark background with gold, gray, and blue circular nodes connected by lines, each node features an icon and text area. This slide effectively visualizes relationships where a central concept expands to surrounding elements, such as business areas, organizational structure, core values, or strategic divisions. The 2-slide set offers multiple color combinations optimized for 16:9 widescreen format. Ideal for company presentations, business explanations, and organizational culture talks to emphasize key messages.
Usage Points
-
Main Usage
Visualizes relationships where a central concept expands to multiple surrounding elements. Effectively represents business area classification, organizational structure, core values, strategic divisions, product categories, and service lineups where one central idea branches into several components.
-
How to Use
Use in company presentations when explaining business areas, organizational structure presentations to show departmental roles, and strategy presentations to display core strategies with detailed execution items. Customize the text and icons in each node to match your content and presentation needs.
-
Recommended For
Suitable for executives, business managers, marketing teams, organizational development specialists, and strategic planning teams. Particularly effective for presentations on business diversification, organizational expansion, and new strategy implementation. Can be used in employee training, investor briefings, and client proposal materials.
-
Slide Structure
2-slide set with the first slide featuring a gold central node connected to four gray and blue nodes in a radial pattern, and the second slide showing an alternative color combination. Each node contains a circular background with an icon and text input area, with connecting lines from center to periphery representing hierarchical relationships.
Related Products
-

Diagram of Gaming Device Types – Business Vision and Diversity
#Company Introduction #Business Introduction #Diagram
-

Business Sector Structure Hexagon Diagram – Visual Trend Introduction
#Company Introduction #Business Introduction #Diagram
-

Business Area Diffusion Diagram – Directions for Business Development
#Company Introduction #Business Introduction #Diagram
-

Global Transportation Network Structure – Cluster Diagram
#Company Introduction #Business Introduction #Diagram
