Doughnut Chart Visualizing Service Market Share
RJ0400014_16
- Last Update 05/21/2025
- File Size 0.2MB
- # of Slides 2
- File Format PPTX
- Slide Ratio 16:9
- Color
Keywords
About the Product
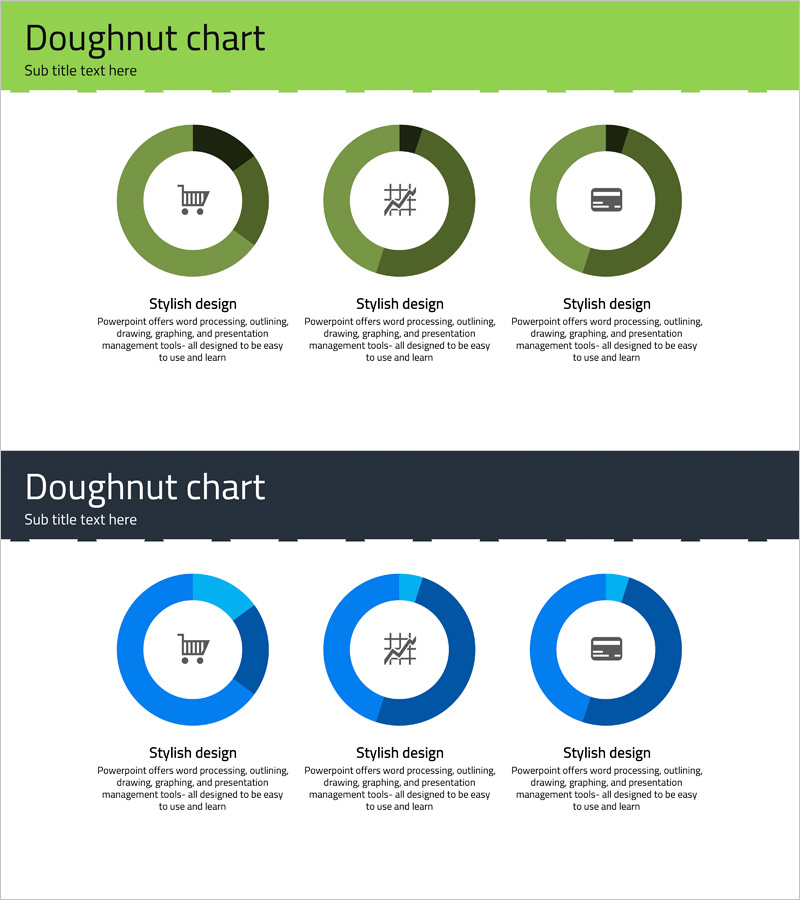
A doughnut chart PowerPoint slide that visualizes service market share and comparative data with clarity and impact. This template features three doughnut charts in green and blue color schemes, each with a centered icon to represent different categories such as shopping, analytics, and payment methods. The slide design is ideal for business presentations, financial reports, and market analysis decks where ratio data needs to be communicated effectively. The 2-slide set offers flexible color combinations, and all text, numbers, and icons are fully editable for immediate use in your presentation.
Usage Points
-
Main Usage
Designed to compare three data categories side-by-side using doughnut charts, making it easy to show market share percentages, customer segment distribution, revenue breakdown, or competitive positioning. The centered icons provide visual context, helping audiences quickly understand what each doughnut represents in your business narrative.
-
How to Use
Simply replace the placeholder text and numbers with your actual data. Use PowerPoint's built-in chart tools to adjust doughnut sizes, colors, and proportions. Icons can be swapped from the icon library to match your specific categories. The slide is ready to insert into quarterly reports, investor presentations, or board meetings.
-
Recommended For
Marketing managers, financial analysts, business development teams, and executives presenting market analysis, customer demographics, or financial performance. Particularly effective in B2B proposals, quarterly earnings reports, investor pitch decks, and strategic planning presentations where stakeholders need to understand data distribution at a glance.
-
Slide Structure
Two-slide template with green-toned doughnuts (lime, olive, dark green) and blue-toned doughnuts (light blue, sky blue, dark blue) on separate slides. Each doughnut features a centered icon (shopping cart, chart, credit card) with title and descriptive text areas below for easy customization and data entry.
Related Products
-

Travel Guide Business Goal Market Strategy Donut Chart – Market Share Analysis
#Market and Competitor Analysis #Marketing Plan and Strategy #Graph
-

Analyzing Market Share with Donut Chart – Clean and Stylish Design
#Company Introduction #Market and Competitor Analysis #Graph
-

Market Share Donut Chart for Eco-Friendly Businesses – Trends and Insights
#Market and Competitor Analysis #Graph #Market Share
-

Beer Carbonated Doughnut Chart – Market Share Analysis
#Market and Competitor Analysis #Financial Plans and Performance #Graph
