Blue Pink Business Goals Connection Diagram
RJ0400006_14
- Last Update 05/18/2025
- File Size 0.7MB
- # of Slides 2
- File Format PPTX
- Slide Ratio 16:9
- Color
Keywords
- #Content-Based Slides
- #Design-Based Slides
- #Business Vision and Strategy
- #Business Strategy
- #Diagram
- #Business Goals
- #Cluster
- #Chain Diagram
- #Project Progress
- #16:9
- #circular diagram PowerPoint
- #5-step connection diagram
- #business goals PowerPoint slide
- #process flow diagram
- #diagram PowerPoint slide template
About the Product
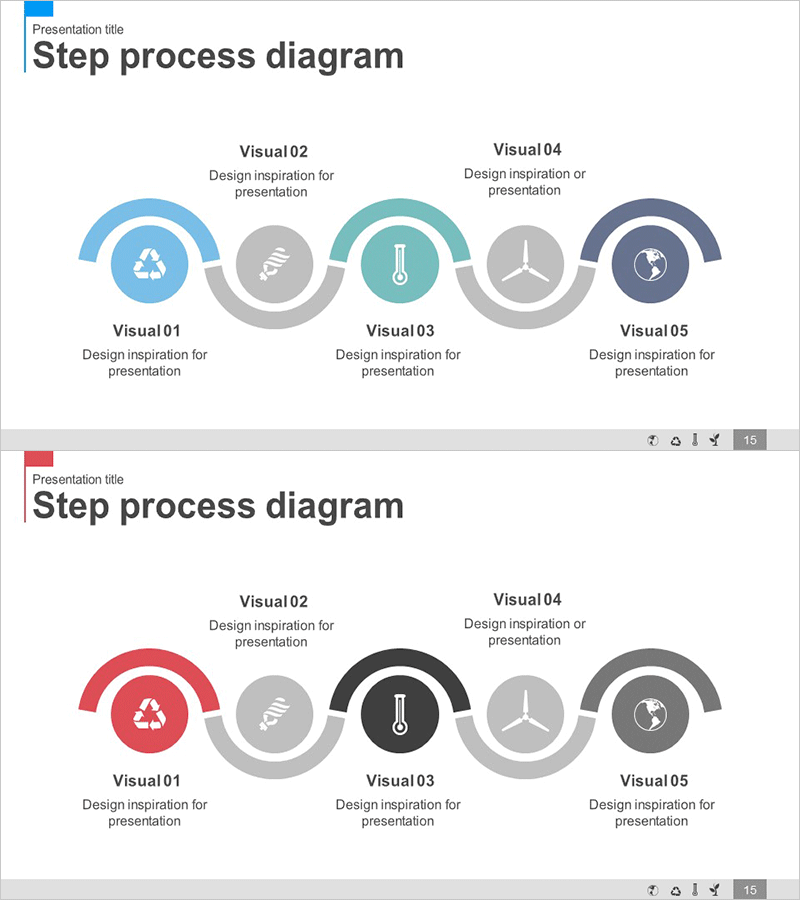
A 5-step circular connection diagram PowerPoint slide that visualizes business goals and strategies in a sequential flow. The design uses four color combinations—blue, pink, teal, and gray—to distinguish each stage, with central connecting lines that clearly show process flow and interdependencies. Delivered in 2-slide format (16:9 aspect ratio), this template is ready to use for business planning presentations, strategic roadmap discussions, and vision-setting sessions. Each node accommodates icons and text, enabling you to communicate organizational values, business direction, and implementation strategies effectively.
Usage Points
-
Main Usage
Represents organizational business goals, strategies, and implementation directions through a 5-step circular structure, emphasizing interconnectedness and cyclical processes. Ideal for executive briefings, business plan presentations, and organizational vision-sharing sessions where complex strategies need intuitive visual communication.
-
How to Use
Input business objectives, key strategies, and implementation tasks into each stage node. Use color differentiation to represent priorities or departmental roles, and leverage the central connecting lines to emphasize inter-stage relationships. Deploy in executive meetings, company-wide workshops, and strategic planning presentations.
-
Recommended For
Recommended for executives, strategic planning teams, business development teams, and organizational development professionals presenting business vision, mid-term management plans, and organizational strategies. Particularly suited for presentations emphasizing cyclical processes or interconnected goal structures.
-
Slide Structure
Five circular nodes (blue, pink, teal, gray, navy) connected by central lines in a circular arrangement. Each node includes an icon (recycling, technology, thermometer, wind turbine, globe) and text input area. Two-slide format provides color combination variations.
Related Products
-

Journey to a Goal Slide – Emphasizing Business Strategy
#Business Vision and Strategy #Business Strategy #Diagram
-

Medical Business Goals Connection Diagram - Intuitive Representation of Vision and Strategy
#Business Vision and Strategy #Business Strategy #Diagram
-

Science Business Goals Connection Diagram – Vision and Strategy
#Business Vision and Strategy #Business Strategy #Diagram
-

Medical Business Goal Connection Diagram - Business Strategy
#Business Vision and Strategy #Business Strategy #Diagram
