Market Share Donut Pie Chart – Clear Analysis
RJ0400012_5
- Last Update 05/20/2025
- File Size 1.7MB
- # of Slides 2
- File Format PPTX
- Slide Ratio 16:9
- Color
Keywords
About the Product
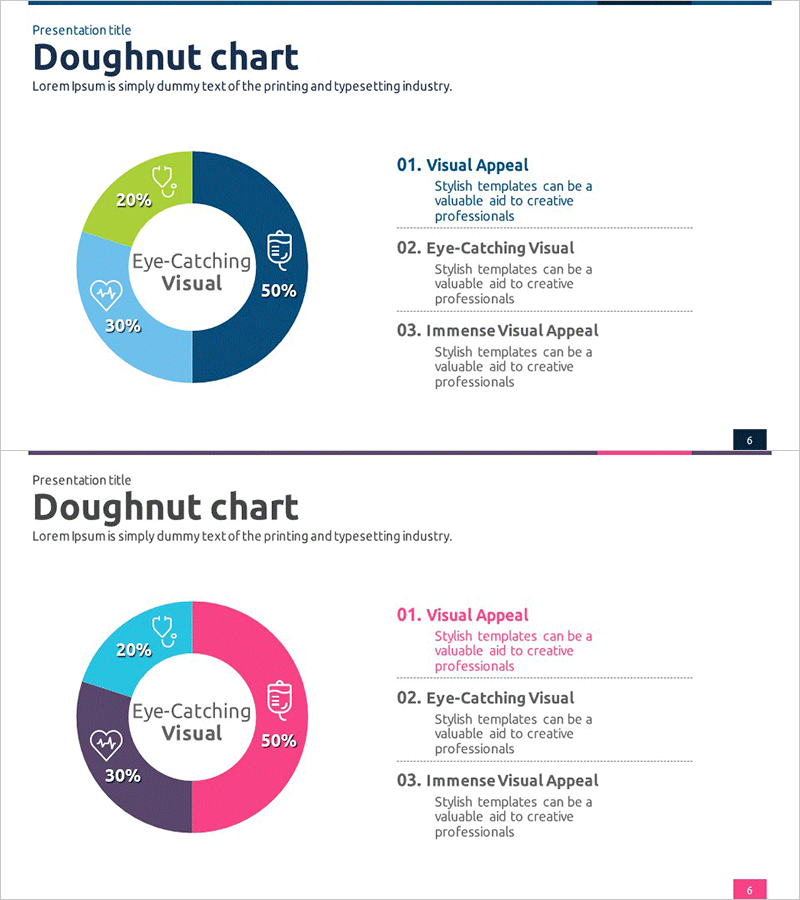
A donut pie chart PowerPoint slide template designed to visualize market share, revenue composition, customer distribution, and other proportional data across four segments. The chart uses four distinct colors—dark blue, light blue, lime green, and pink—to differentiate each segment, with a central text area for highlighting key messages or total figures. Two color variations (blue tone and pink tone) are provided, allowing you to match your presentation theme. The right side includes three text blocks for detailed explanations of each segment, ensuring clear data interpretation. Optimized for 16:9 widescreen format and fully editable in PowerPoint.
Usage Points
-
Main Usage
Clearly visualize proportional data such as market share, revenue breakdown, customer demographics, and budget allocation across four categories. The donut structure allows you to place key messages or total figures in the center, maximizing information clarity. With four segments, the chart remains uncluttered while providing sufficient data representation.
-
How to Use
Use this slide in executive reports, business analysis presentations, marketing strategy meetings, and investor pitch decks to explain market conditions or business performance. Enter segment values and add interpretation text in the right-side text blocks for quick audience comprehension. Select your preferred color combination to align with corporate branding or presentation theme.
-
Recommended For
Ideal for executives, business analysts, marketing managers, financial analysts, consultants, and sales leaders presenting quantitative data to support decision-making. Particularly effective for market analysis, competitive comparison, customer segmentation, revenue structure analysis, and other ratio-based information delivery.
-
Slide Structure
2-slide set. Slide 1: Dark blue, light blue, lime green, and pink 4-segment donut chart with center text area and three right-side explanation blocks. Slide 2: Pink, purple, cyan, and pink tone donut chart with identical layout. 16:9 widescreen format, PPTX file with fully editable numbers and text.
Related Products
-

Analyzing Market Share with Donut Chart – Clean and Stylish Design
#Company Introduction #Market and Competitor Analysis #Graph
-

Visualizing Market Share with Watercolor Donut Chart
#Market and Competitor Analysis #Graph #Market Share
-

Watercolor Customer Analysis Donut Chart – Visualizing Market Share
#Market and Competitor Analysis #Graph #Market Share
-

Travel Guide Business Goal Market Strategy Donut Chart – Market Share Analysis
#Market and Competitor Analysis #Marketing Plan and Strategy #Graph
