Competitor Analysis Area Graph – Effective Market Strategy Development
RJ0400011_32
- Last Update 05/20/2025
- File Size 0.3MB
- # of Slides 2
- File Format PPTX
- Slide Ratio 16:9
- Color
Keywords
About the Product
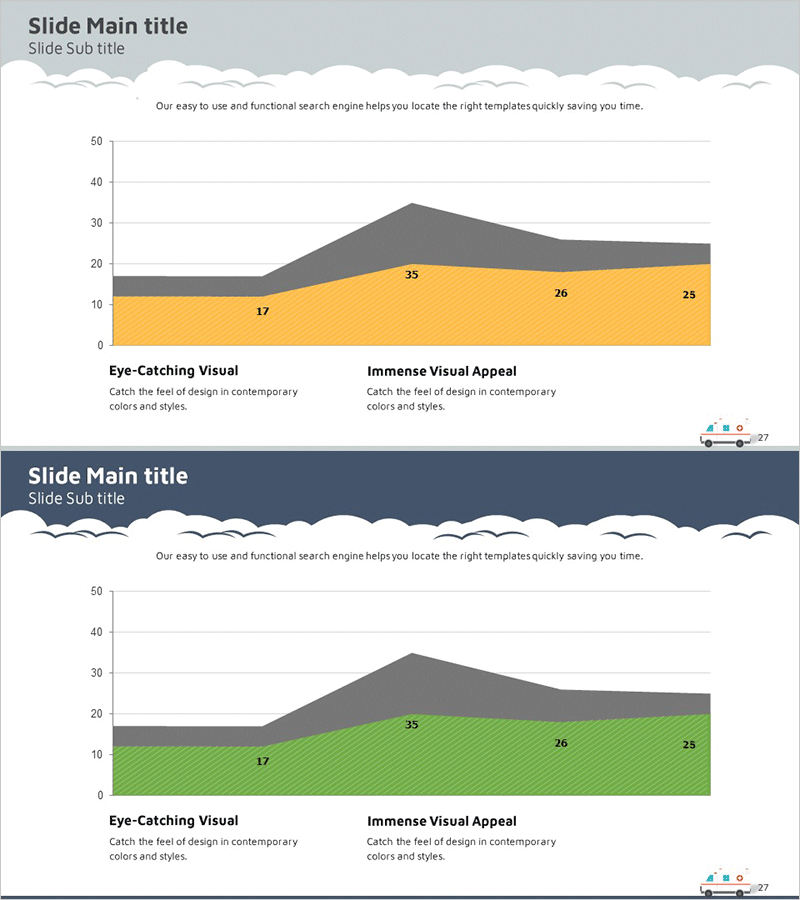
A PowerPoint slide featuring a stacked area graph for competitive analysis. The chart uses two color layers (gray and orange or green) to visualize competitive metrics over time, with numerical labels (17, 35, 26, 25) clearly displayed for market share, customer satisfaction, or sales volume comparison. The slide includes a descriptive text section at the top and two analysis sections at the bottom to highlight competitive advantages and market opportunities. Provided as a 16:9 widescreen 2-slide set, fully editable and ready for immediate use in business presentations.
Usage Points
-
Main Usage
Visualize competitor analysis data using a stacked area graph to clearly communicate market position and competitive trends. The two-layer structure (gray and orange/green) enables simultaneous comparison of multiple metrics, while numerical labels ensure accurate data interpretation. Ideal for executive, investor, and partner presentations to substantiate competitive advantages.
-
How to Use
Enter analysis background (market overview, analysis period) in the top text area and replace graph values with actual data. Complete the two bottom sections with specific competitive strengths and market opportunities to provide data-driven strategic justification.
-
Recommended For
Use in business plans, investment pitch decks, strategy reports, and market analysis presentations within the competitive landscape section. Recommended for marketing managers, business development teams, and executives explaining competitive positioning.
-
Slide Structure
The slide comprises a title and subtitle area, one descriptive text section, one dual-color stacked area graph, and two bottom sections (each with heading and description). The 2-slide set includes color variations (orange/green) for flexible adaptation to document branding.
Related Products
-

Gradient Theme Area Diagram – Market and Competitor Analysis
#Market and Competitor Analysis #Diagram #Graph
-

Vertical Bar Chart Slide for Business Competitive Advantage Analysis
#Market and Competitor Analysis #Graph #Other
-

Bank Securities Service Area Graph – Market Analysis and Competitive Advantage
#Market and Competitor Analysis #Graph #Other
-

Space Theme Area Graph – Market and Competitor Analysis
#Market and Competitor Analysis #Graph #Other
