Renewable Energy Company History Diagram
RJ0600048_5
- Last Update 07/03/2025
- File Size 1.8MB
- # of Slides 2
- File Format PPTX
- Slide Ratio 16:9
- Color
Keywords
- #Content-Based Slides
- #Design-Based Slides
- #Company Introduction
- #Business Vision and Strategy
- #Diagram
- #History
- #Business Goals
- #Cluster
- #Chain Diagram
- #16:9
- #timeline diagram PowerPoint
- #company history slide template
- #linear process diagram PPT
- #5-stage timeline presentation
- #corporate vision diagram download
About the Product
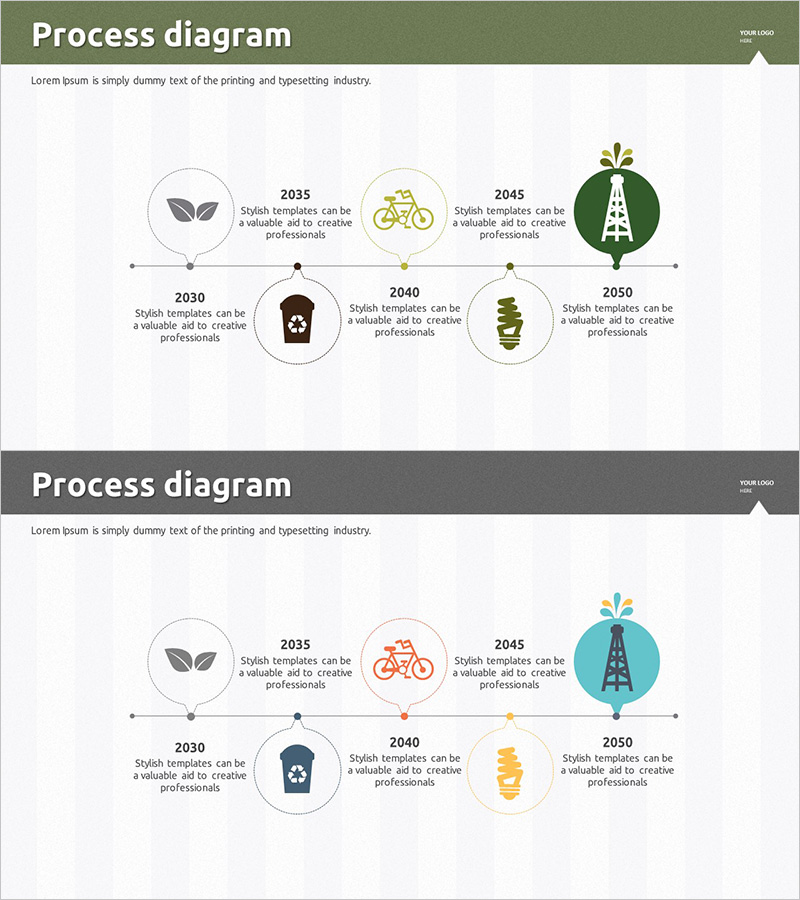
A linear timeline diagram PowerPoint slide that visualizes the business development journey of a renewable energy company across five milestone stages from 2030 to 2050. The design features circular nodes connected by a central horizontal line, with each node containing an icon, year label, and descriptive text. The alternating top-and-bottom layout creates a natural information flow that guides viewers through the company's strategic evolution. Two color variations—green and blue tones—are included, allowing you to match your corporate brand identity. This slide deck is ideal for company overview presentations, business plan decks, and investor pitch materials where you need to showcase your organization's growth trajectory and long-term vision.
Usage Points
-
Main Usage
Effectively communicate your company's long-term business vision and historical milestones in chronological order. The five-node timeline (2030–2050) visualizes your organization's strategic direction and growth objectives at a glance, making it ideal for executive presentations and stakeholder communications.
-
How to Use
Use this slide in the company history section of corporate overview presentations, the vision and strategy pages of business plans, and investor pitch decks when explaining your organization's medium- to long-term roadmap. Simply edit the node text and icons to reflect your actual years and key business achievements for immediate deployment.
-
Recommended For
Recommended for renewable energy and clean tech company executives, business development teams, and marketing professionals presenting corporate vision. Also suitable for consulting firms, investment companies, and government agencies explaining organizational strategy and long-term planning.
-
Slide Structure
Five circular nodes (2030, 2035, 2040, 2045, 2050) alternating above and below a central horizontal line. Each node contains an icon, year label, and descriptive text. Two color schemes provided: green tone (leaf, bicycle, building icons) and blue tone (tower icon) versions.
Related Products
-

Timeline Diagram for Business Goals and Schedule – Journey to Achieve Vision
#Company Introduction #Business Vision and Strategy #Diagram
-

Diagram Slide Visualizing Orange & Green Future Goals
#Company Introduction #Business Vision and Strategy #Diagram
-

List of Studies by Year Slide – Business Strategy and Vision
#Company Introduction #Business Vision and Strategy #Diagram
-

Traditional PPT Future Goals and Schedule Plan – Vision-Embedded Cluster
#Company Introduction #Business Vision and Strategy #Diagram
