Learning Subject Diffusion Diagram - Visualizing Connections of Information
RJ0500009_6
- Last Update 06/09/2025
- File Size 0.3MB
- # of Slides 2
- File Format PPTX
- Slide Ratio 16:9
- Color
Keywords
- #Content-Based Slides
- #Design-Based Slides
- #Company Introduction
- #Business Introduction
- #Diagram
- #Business Areas
- #Technological Status
- #Spread
- #Centralized Diagram
- #16:9
- #radial diagram PowerPoint
- #diffusion diagram slide
- #5-node diagram template
- #information visualization PPT
- #center-based diagram design
About the Product
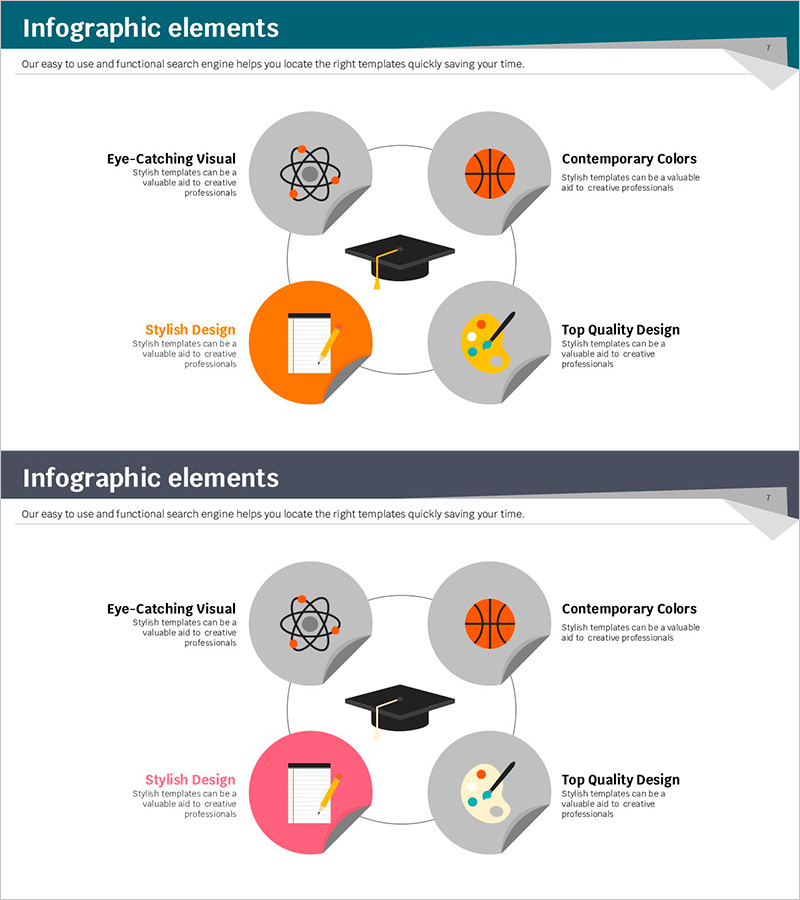
A radial diffusion diagram PowerPoint slide where information spreads from a central concept to five directional nodes. Gray hexagonal nodes feature icons (atom, basketball, graduation cap, document, palette) to visualize learning subjects, business topics, organizational functions, and information systems. The orange center node contrasts with gray peripheral nodes to clearly express hierarchical relationships, while connecting lines emphasize node relationships. The 2-slide set features varying header colors (teal, gray, teal) for immediate use across diverse presentation scenarios.
Usage Points
-
Main Usage
Expresses five detailed items, functions, or domains radiating from a central concept or core theme. Ideal for visualizing learning subject connections, organizational department structures, business function classifications, marketing channel distribution, and project area assignments where information flows from center to periphery.
-
How to Use
Enter the core concept (e.g., learning, business, organization name) in the center node and fill five peripheral nodes with detailed items. Icons can be customized to match each item's characteristics or replaced with text only. Use the 2-slide set with different header colors for section differentiation or comparative analysis.
-
Recommended For
Recommended for academic department introductions, corporate organizational structure explanations, marketing team channel strategy presentations, consulting report function classifications, and project management area responsibility visualizations. Effectively communicates information hierarchy to executives, employees, students, and clients.
-
Slide Structure
Composed of 1 center node (orange hexagon) + 5 peripheral nodes (gray hexagons). Each node includes icon and text area. Connecting lines link center to peripheral nodes, expressing relationships. The 2-slide set features varying header colors (teal, gray, teal) for visual variety.
Related Products
-

Science Business Area Diffusion Diagram – Connecting the Future of Business
#Company Introduction #Business Introduction #Diagram
-

Pill Ingredient Analysis Diagram – Effective Visualization for Business Introduction
#Company Introduction #Business Introduction #Diagram
-

Medical Business Sector Diffusion Diagram - Clarifying Business Structure
#Company Introduction #Business Introduction #Diagram
-

Diffusion Diagram of Science Business Areas – Innovation and Integration
#Company Introduction #Business Introduction #Diagram
