Pill Ingredient Analysis Diagram – Effective Visualization for Business Introduction
RJ0700014_22
- Last Update 07/25/2025
- File Size 1.5MB
- # of Slides 2
- File Format PPTX
- Slide Ratio 16:9
- Color
Keywords
- #Content-Based Slides
- #Design-Based Slides
- #Company Introduction
- #Business Introduction
- #Diagram
- #Business Areas
- #Technological Status
- #Spread
- #Centralized Diagram
- #16:9
- #radial diagram PowerPoint
- #center diagram slide template
- #4-section diagram presentation
- #component analysis PPT
- #business introduction diagram
About the Product
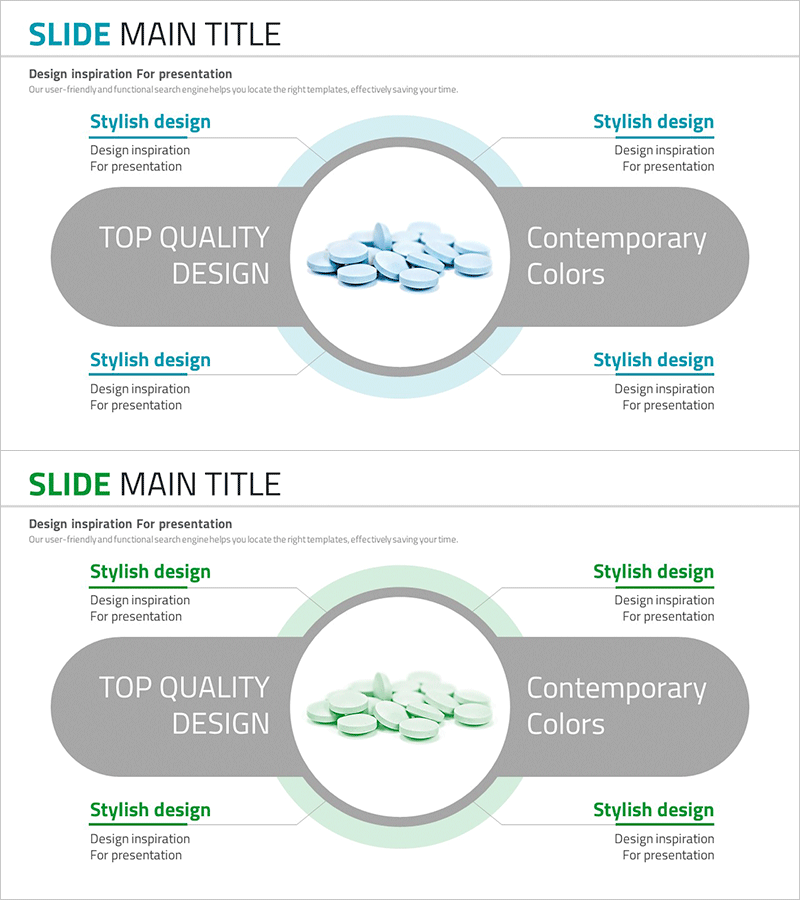
A radial diagram PowerPoint slide featuring a circular image at the center connected to four directional gray text boxes. The light blue circular background and gray accent boxes create clear information hierarchy for presenting product components, technical elements, or business features. The 2-slide set includes color variations in blue and green tones, allowing you to match your presentation style. Text fields are fully editable for immediate use in company introductions, business overviews, and technology status presentations. Ideal for visualizing how multiple elements radiate from a central concept.
Usage Points
-
Main Usage
Visualizes how multiple elements radiate outward from a central concept or image. Effectively presents product components, technical architecture, business characteristics, or organizational roles where one core idea branches into four distinct areas.
-
How to Use
Place your core image or logo in the center circular area, then enter title and description text in each of the four gray boxes. The light blue circular border naturally draws audience attention to the center point. Perfect for technology sections in company profiles, product analysis in business plans, and investor pitch decks.
-
Recommended For
Product development teams, marketing professionals, business strategists, and technical experts who need to communicate complex information clearly and concisely. Especially suited for presentations requiring equal emphasis on four components such as ingredients, features, benefits, and applications.
-
Slide Structure
2-slide set with identical layout structure. Each slide features a central circular image area surrounded by four directional gray text boxes (title and description fields editable). First slide uses light blue tone; second slide provides light green variation for visual flexibility.
Related Products
-

Diffusion Diagram of Science Business Areas – Innovation and Integration
#Company Introduction #Business Introduction #Diagram
-

Learning Subject Diffusion Diagram - Visualizing Connections of Information
#Company Introduction #Business Introduction #Diagram
-

Medical Business Sector Diffusion Diagram - Clarifying Business Structure
#Company Introduction #Business Introduction #Diagram
-

Science Business Area Diffusion Diagram – Connecting the Future of Business
#Company Introduction #Business Introduction #Diagram
