COVID-19 Support Business Areas Diagram – Visualizing Business Domains
RJ0700023_7
- Last Update 07/28/2025
- File Size 0.8MB
- # of Slides 2
- File Format PPTX
- Slide Ratio 16:9
- Color
Keywords
- #Content-Based Slides
- #Design-Based Slides
- #Company Introduction
- #Business Introduction
- #Diagram
- #Business Areas
- #Business Areas
- #Spread
- #Centralized Diagram
- #16:9
- #radial diagram PowerPoint
- #central concept diagram slide
- #4-node diagram template
- #business relationship diagram
- #how to create radial diagram in PowerPoint
About the Product
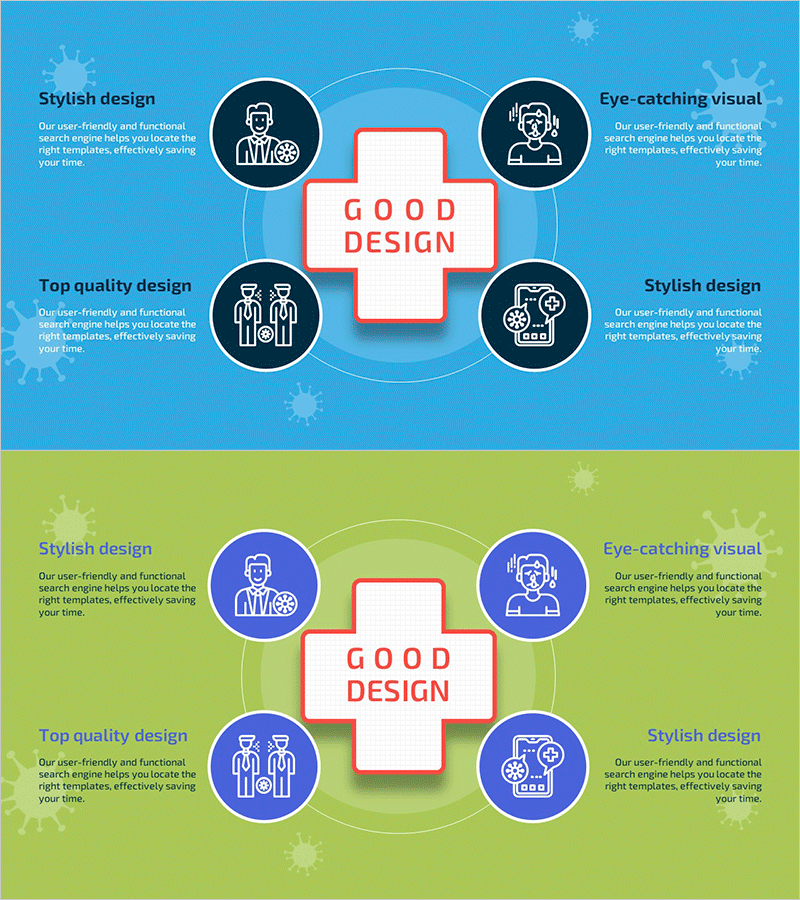
A PowerPoint radial diagram slide featuring a central concept box surrounded by four related items arranged in a circular pattern. The design includes a bright blue and lime green background version, white circular nodes with icons, and a red central box with connecting lines. This 2-slide set provides color variations to match your presentation theme and audience. Ideal for visualizing business domains, core values, organizational structures, strategic pillars, and conceptual relationships in professional presentations.
Usage Points
-
Main Usage
Clearly visualize the relationship between a central concept and four related elements or supporting ideas. Effectively communicates equal importance of multiple items or shows how various components derive from a single core concept. Perfect for explaining organizational values, business domains, strategic initiatives, or service offerings.
-
How to Use
Enter your central concept in the red box at the center. Add related items and descriptions to each of the four circular nodes. Customize icons to match your organization's branding or content focus. Adjust text size and formatting to emphasize key points. Choose between the blue or green background version based on your presentation theme and audience preferences.
-
Recommended For
Executive presentations, company vision and strategy sessions, organizational structure explanations, business domain introductions, product or service portfolio overviews, marketing strategy presentations, training and seminar materials. Particularly effective when you need to present multiple related concepts with equal emphasis around a central theme.
-
Slide Structure
2-slide set with identical layouts in two color variations: bright blue background (slide 1) and lime green background (slide 2). Each slide features a central red-bordered box, four white circular nodes with icons positioned around it, connecting lines linking center to nodes, and text areas for titles and descriptions.
Related Products
-

Business Area Circular Diagram – Enhancing Corporate Presence
#Company Introduction #Business Introduction #Diagram
-

Business Value Diagram – Visualizing Business Sectors
#Company Introduction #Business Introduction #Diagram
-

Mobile Security Service Diagram
#Company Introduction #Business Introduction #Diagram
-

Infographic Slide Visualizing Collaborative Business Areas
#Company Introduction #Business Introduction #Diagram
