Global Environment Analysis Pie Chart – Quintessence of Data Visualization
RJ0400006_6
- Last Update 05/18/2025
- File Size 0.7MB
- # of Slides 2
- File Format PPTX
- Slide Ratio 16:9
- Color
Keywords
- #Content-Based Slides
- #Design-Based Slides
- #Business Vision and Strategy
- #Market and Competitor Analysis
- #Graph
- #Business Goals
- #Market Analysis
- #Circles
- #Pie Chart
- #16:9
- #pie chart PowerPoint
- #pie graph slide template
- #data visualization PowerPoint
- #ratio chart slide
- #business analysis presentation
About the Product
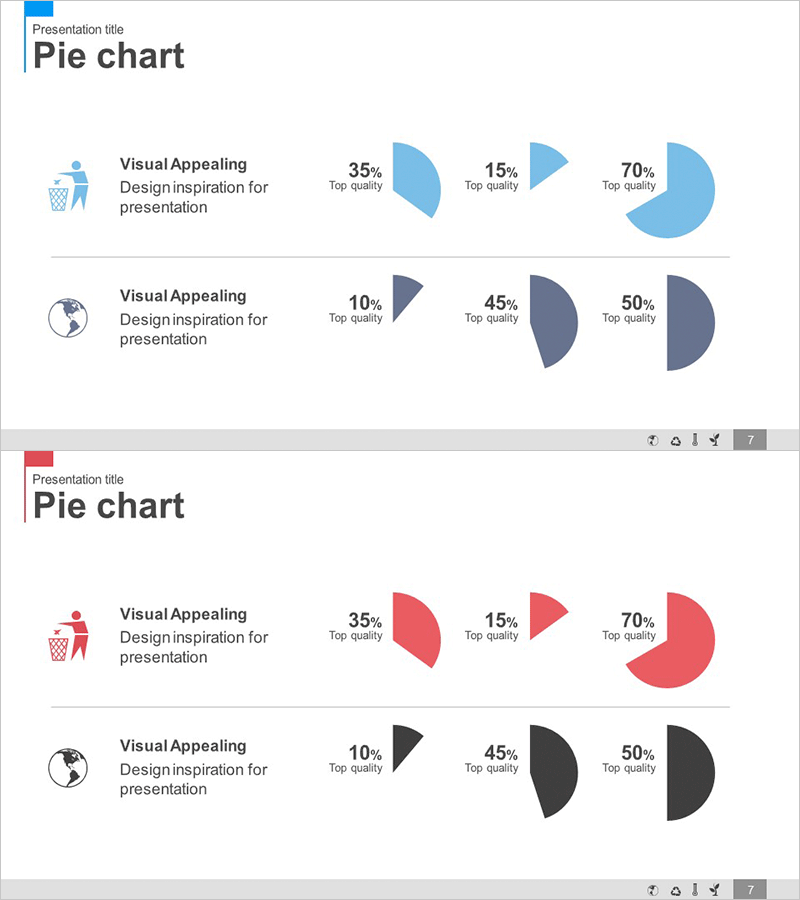
A professional pie chart PowerPoint slide template designed for presenting ratio data such as renewable energy analysis, market share, and budget allocation. The template features two color schemes: light blue and dark gray tones, making it adaptable to various presentation contexts. Each slide displays 3 or 4 segments with clearly labeled percentages and data points. This presentation slide is ready to use for business analysis, environmental reports, and financial presentations.
Usage Points
-
Main Usage
Visualize proportional data such as renewable energy market share, sales composition, budget distribution, and customer segmentation at a glance. Percentage values are displayed alongside each segment for accurate information delivery.
-
How to Use
Apply to market analysis sections in business plans, revenue composition analysis in investor pitch decks, customer segmentation in marketing proposals, and statistical data in reports. Edit segment colors and percentages to match your actual data and customize for your presentation needs.
-
Recommended For
Finance and accounting professionals, marketing strategists, business analysts, consultants, and energy sector specialists who need to present data-driven insights. Recommended for any business presentation requiring clear quantitative information visualization.
-
Slide Structure
Slide 1: Light blue pie chart with 3 segments (35%, 15%, 70% ratios) including icons and labels. Slide 2: Dark gray pie chart with 4 segments (10%, 45%, 50% ratios) with icons and labels. Both slides include a title area and dedicated chart area for easy customization.
Related Products
-

Creative Line PPT Pie Chart Analysis – Visualizing Market Share
#Market and Competitor Analysis #Graph #Market Share
-

Diagram of East, West, North, and South for Business Strategy Visualization – A Creative Approach
#Business Strategy #Market and Competitor Analysis #Diagram
-

Business Note Analysis Circle Graph & Table – Market and Competitive Analysis
#Market and Competitor Analysis #Diagram #Graph
-

Share Analysis of Two Topics with Pie Chart
#Market and Competitor Analysis #Diagram #Graph
